Matplotlib hatch is a pattern that can be used as an overlay in bar charts, shapes and are important to ensure the readability of graphs in the absence of color (when printed in a single color format). Unfortunately, there are only a few patterns available on Matplotlib.By reading this post, you will be able to … Continue reading Matplotlib Custom Hatch Patterns in 5 Steps
Category: python
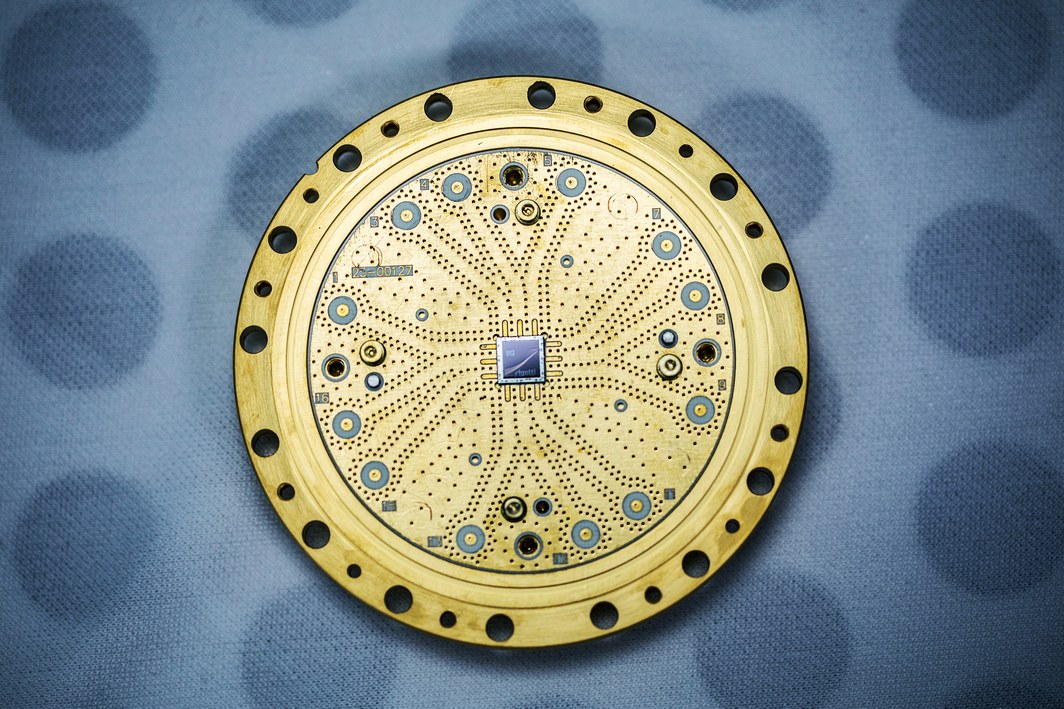
Roll a Dice on a Quantum Computer
When I say "Roll a Dice on a Quantum Computer", technically there is no dice and it's not entirely a click bait. I'm going to simulate and verify the probability of an 8 sided fair dice. Why would I want to waste resources to do such a simple task. Well, a simple answer. There is … Continue reading Roll a Dice on a Quantum Computer
Why You Need Conda to Manage Environments
Are you are confused by the many ways of creating environments in Python?Do you have to use Conda due to restrictions on the machine you're working?This article explains as to why you need Conda. Learn what Conda is and how to use it without wasting your time. I came across Conda when I was working on a … Continue reading Why You Need Conda to Manage Environments
Add Matplotlib Percentage Ticks to a Histogram
Matplotlib provides an easy way of converting your yaxis to percentages. It's just a one liner import matplotlib.ticker as ticker ax.yaxis.set_major_formatter(ticker.PercentFormatter(xmax)) But the issue is you can't space the yticks as you want them to be. Usually you can do this by setting yticks (ax.set_yticks). But the issue is, python converts the axis directly to … Continue reading Add Matplotlib Percentage Ticks to a Histogram

