This article is different from usual blog posts. However, it’s an essential topic often overlooked. There are online cloud service providers who let you create diagrams using in-built templates. But for research, I have found these solutions are not sufficient to create Computer Science diagrams. So I decided to give Adobe Illustrator (AI) a try and I was baffled by the results. Most of the diagrams on my website are created using AI. I’ll also show real life examples where I have used these tools.
AI gives the freedom to draw and have fine grained control over visualizations. In this article, I will explain five steps to get you quickly started on Adobe Illustrator. The version of AI is 2020 (24.2.1).
1. Grids
Here's the home screen when you open AI.1.1 Create New Document
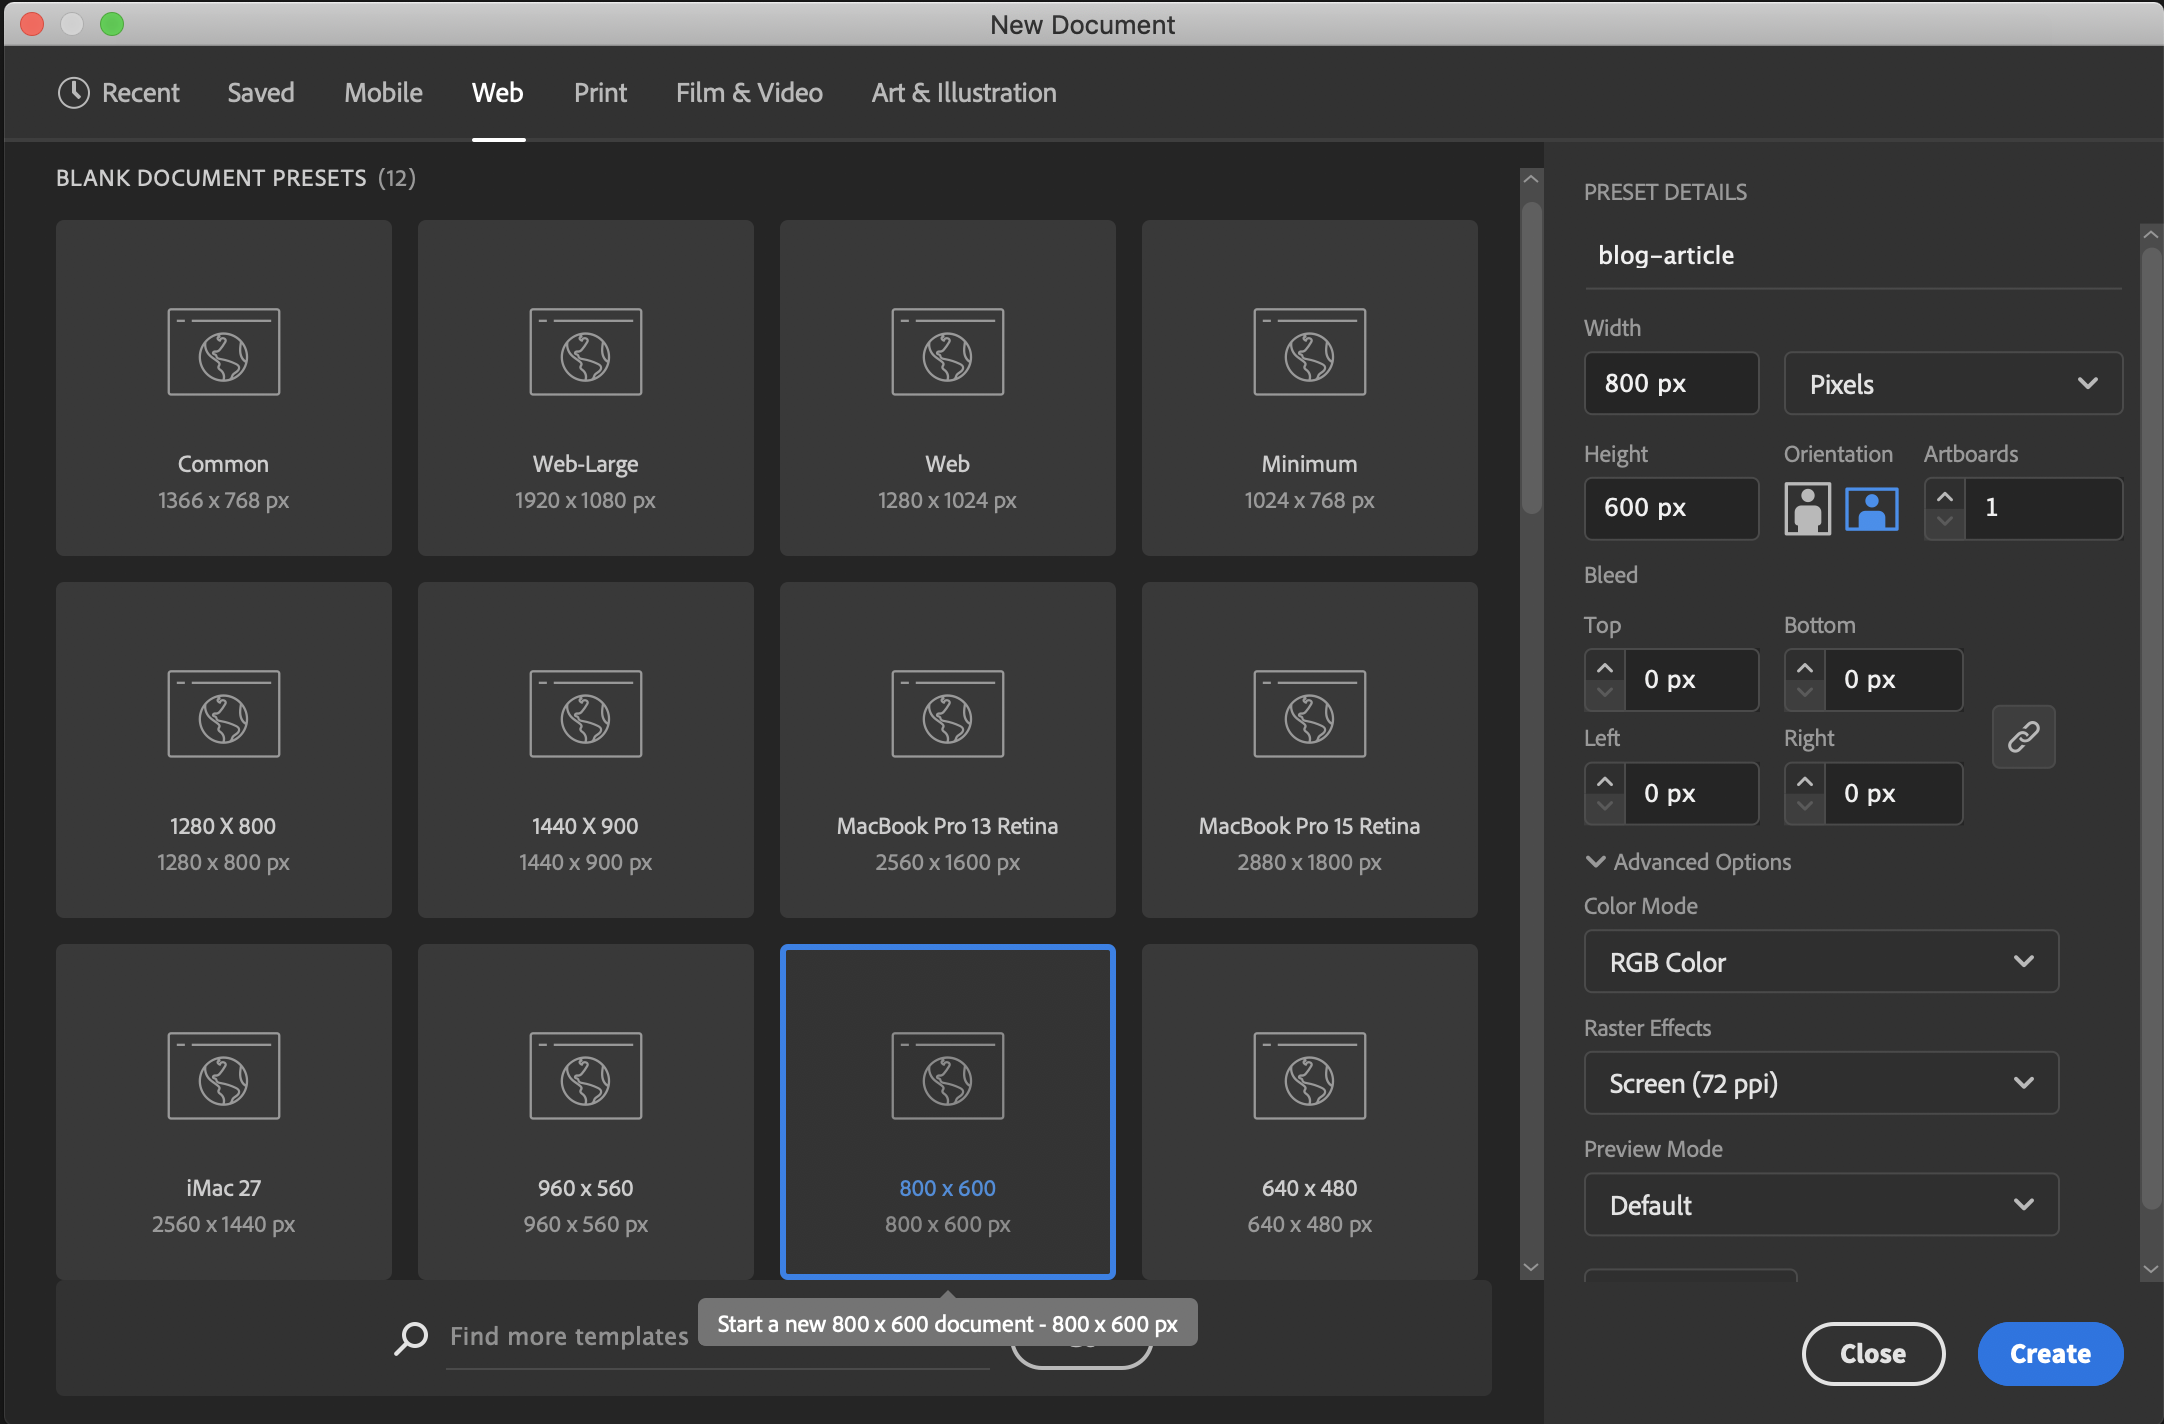
1.2 Enable Grid View
On the Properties pane on your right, there's a separate section for
Ruler & Grids. Using these three options, you can turn on / off the
ruler, grid and transparency grid.
Grid is important to align shapes and gives an idea of how items
should be placed.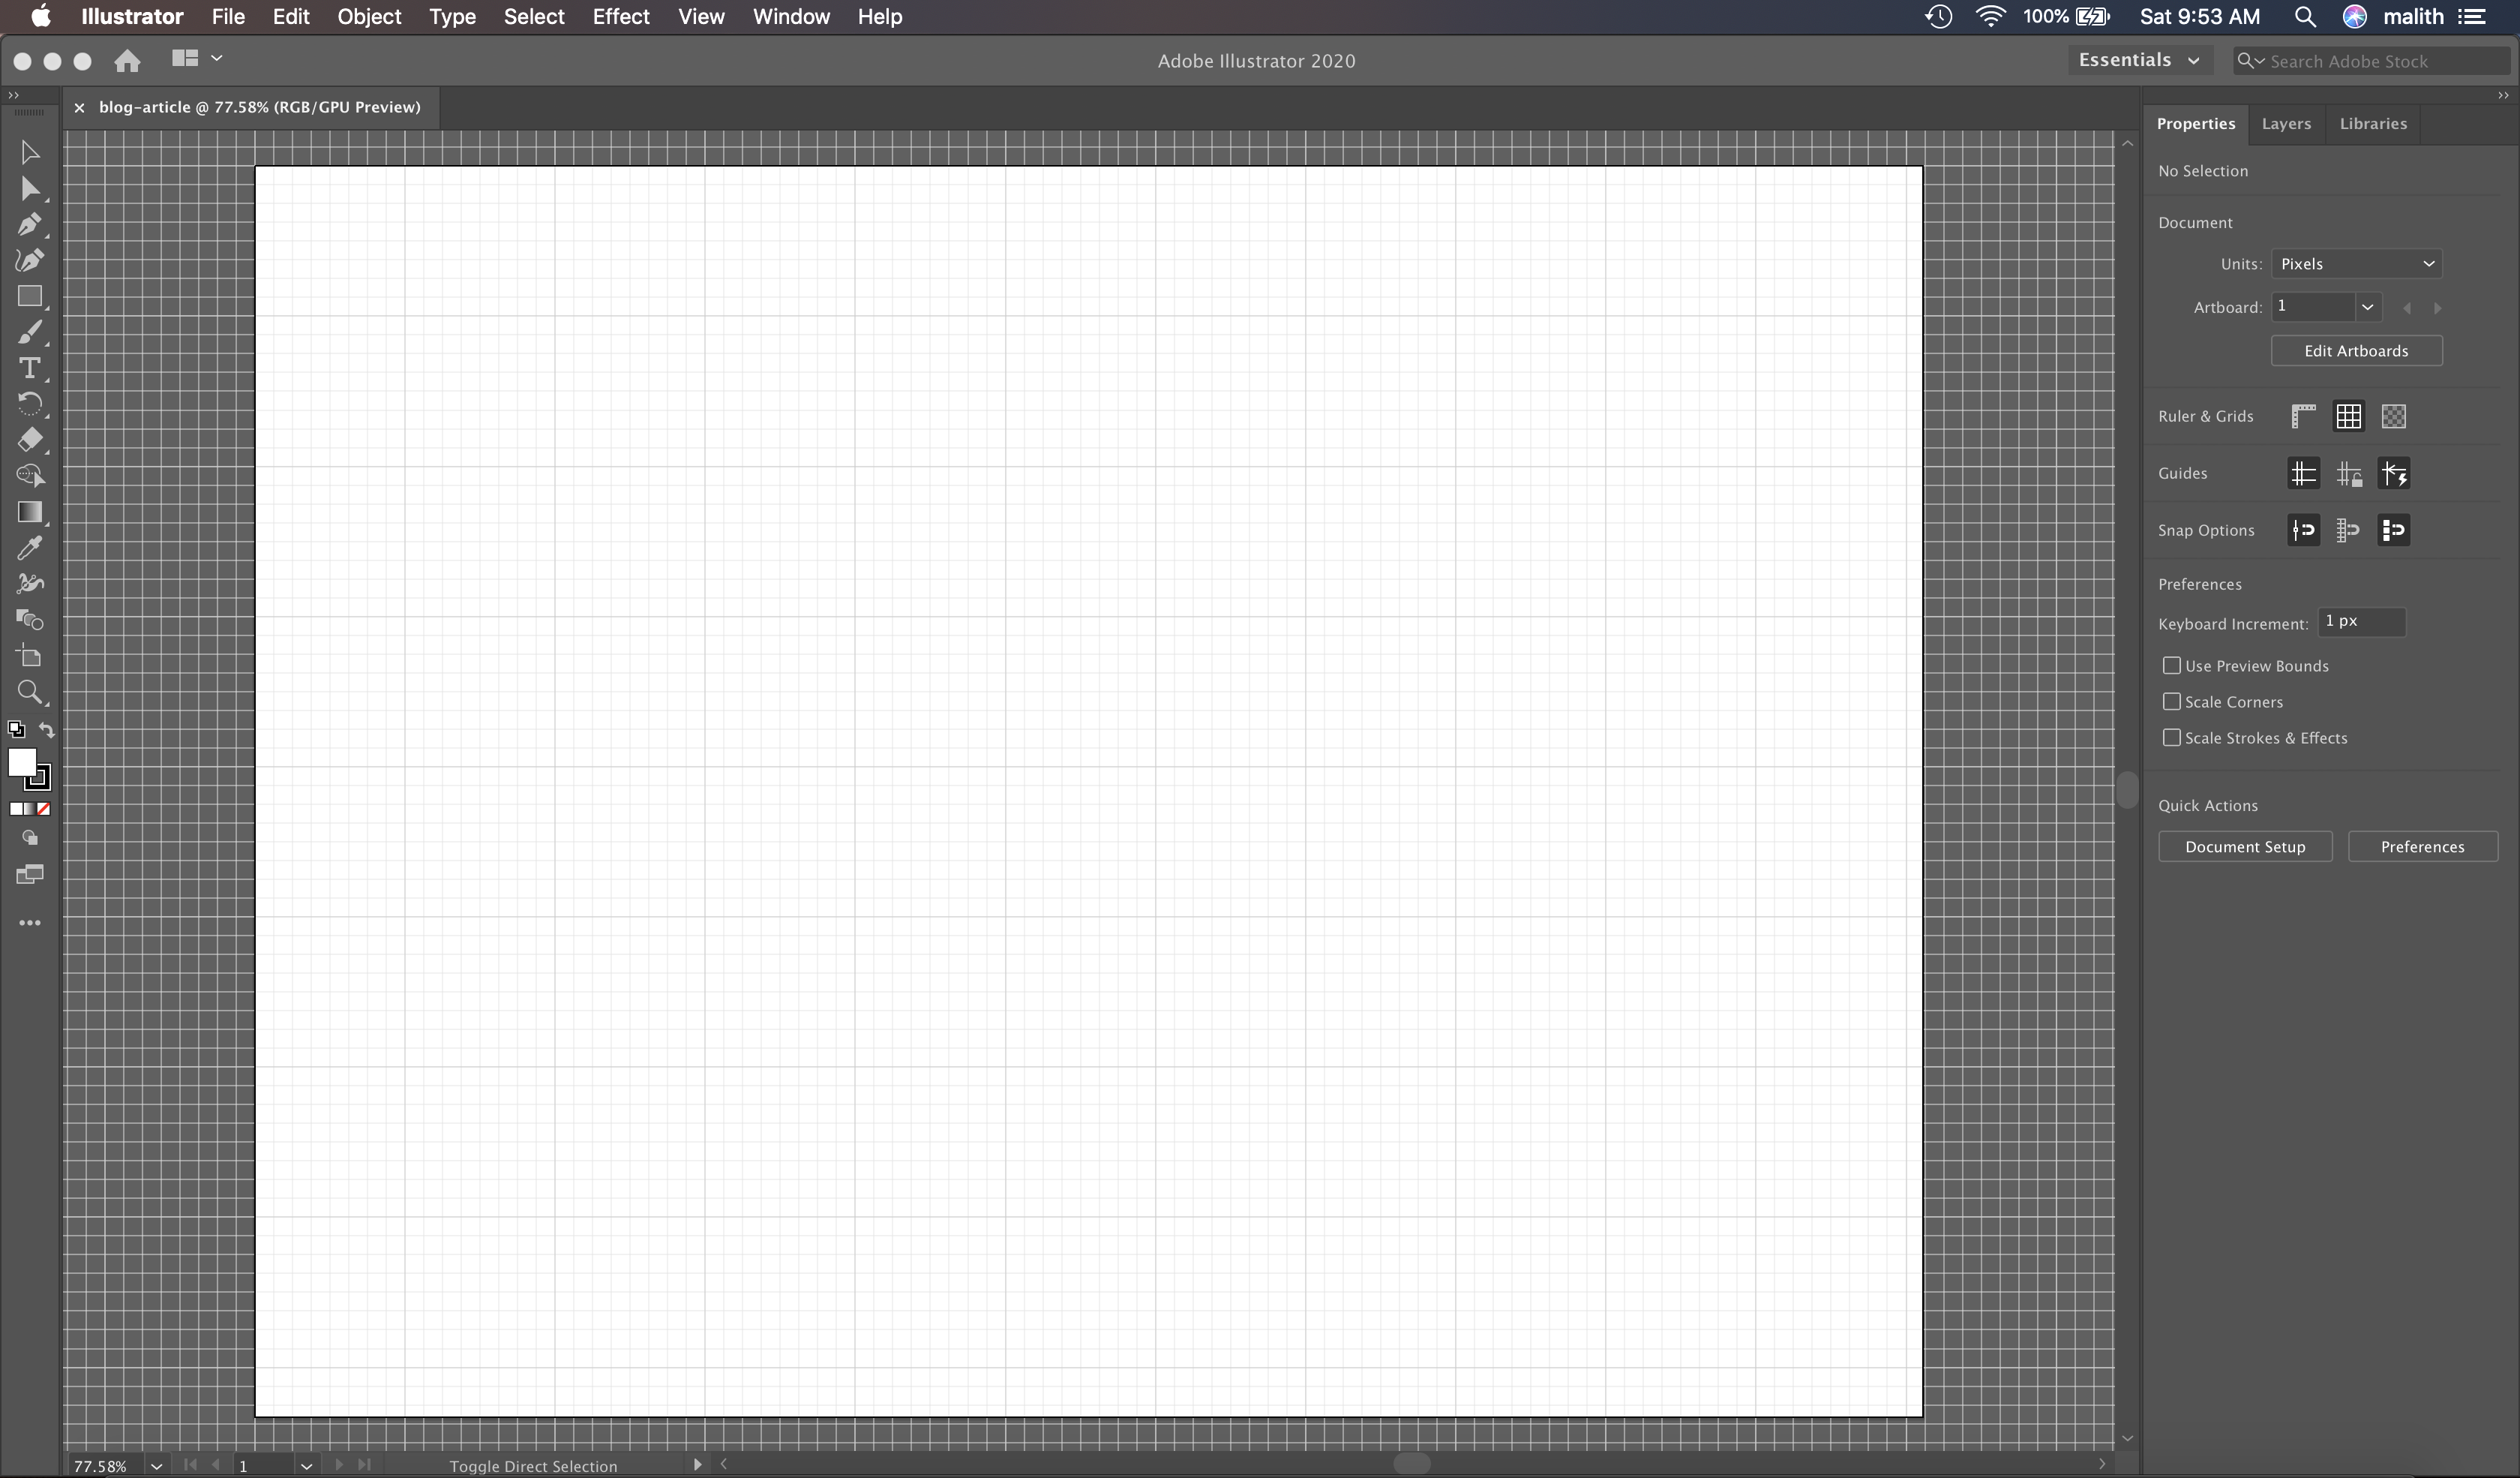
1.3 Create Rectangle using Tool
On the left pane, you can see selection tools along with Rectangle
Tool. Select the Rectangle Tool and move the cursor to the drawing
area. Click and drag to draw the square.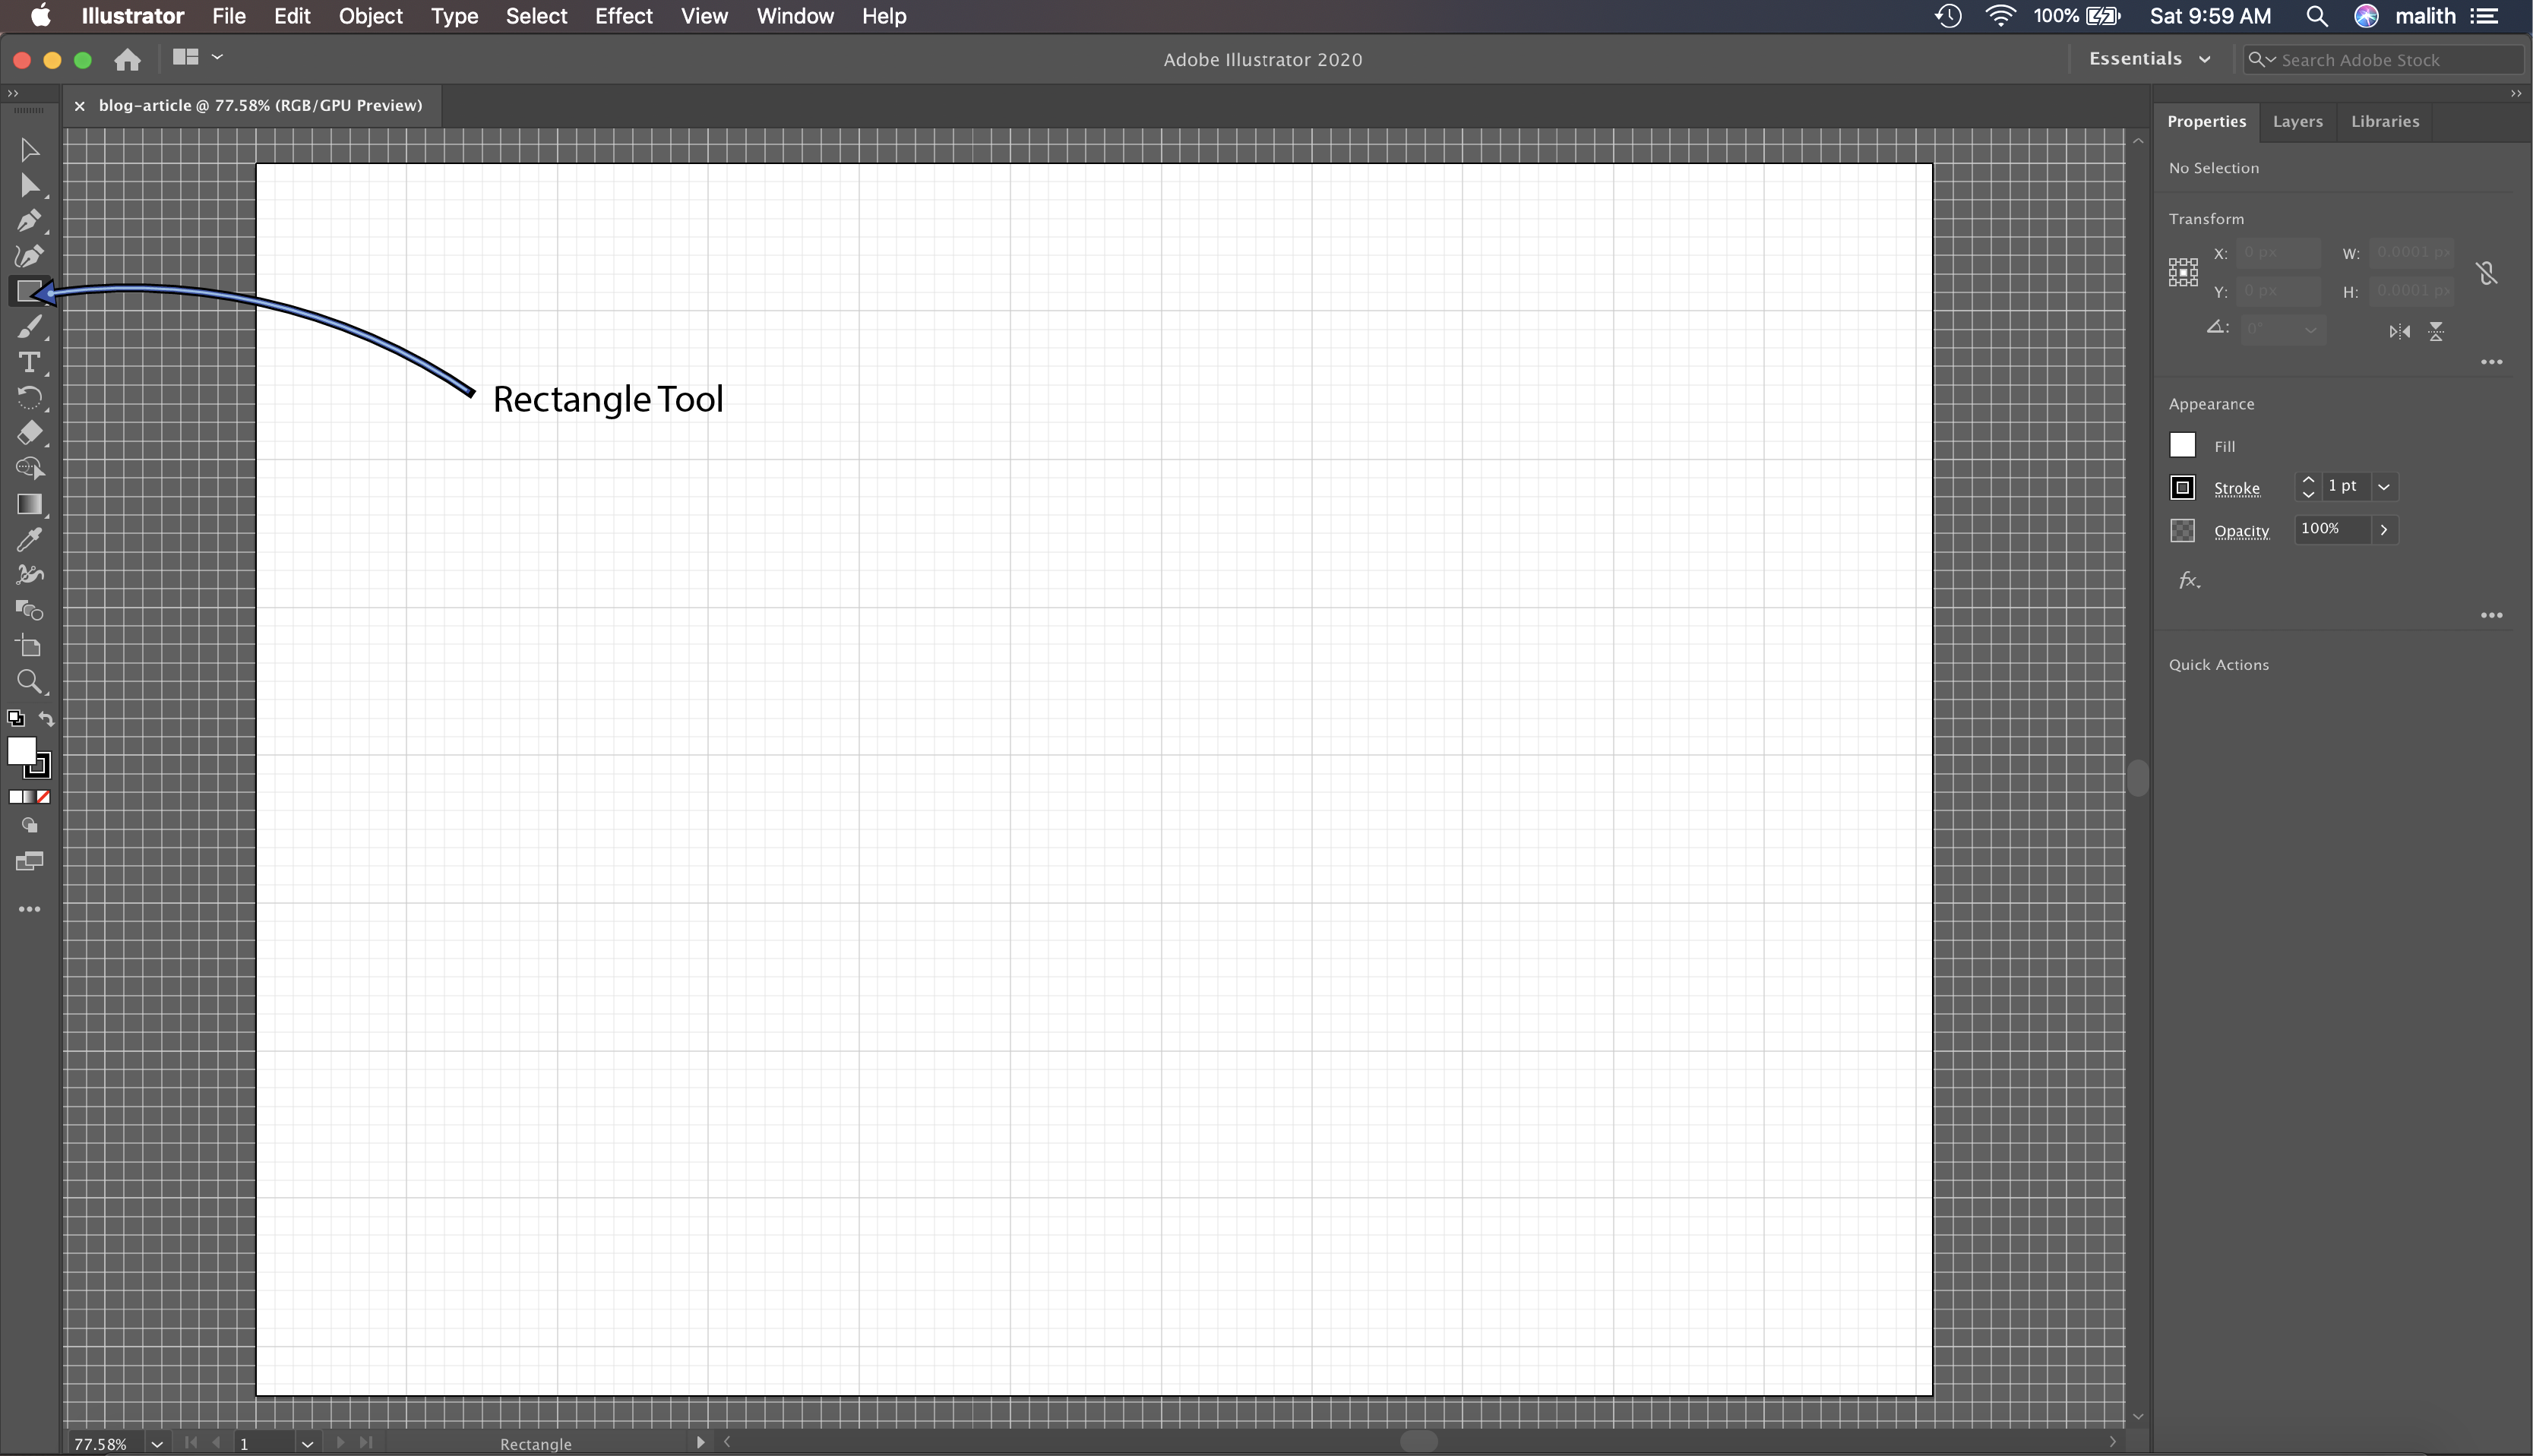
If you click once you will get a prompt like below. enter the desired
dimensions for height and width.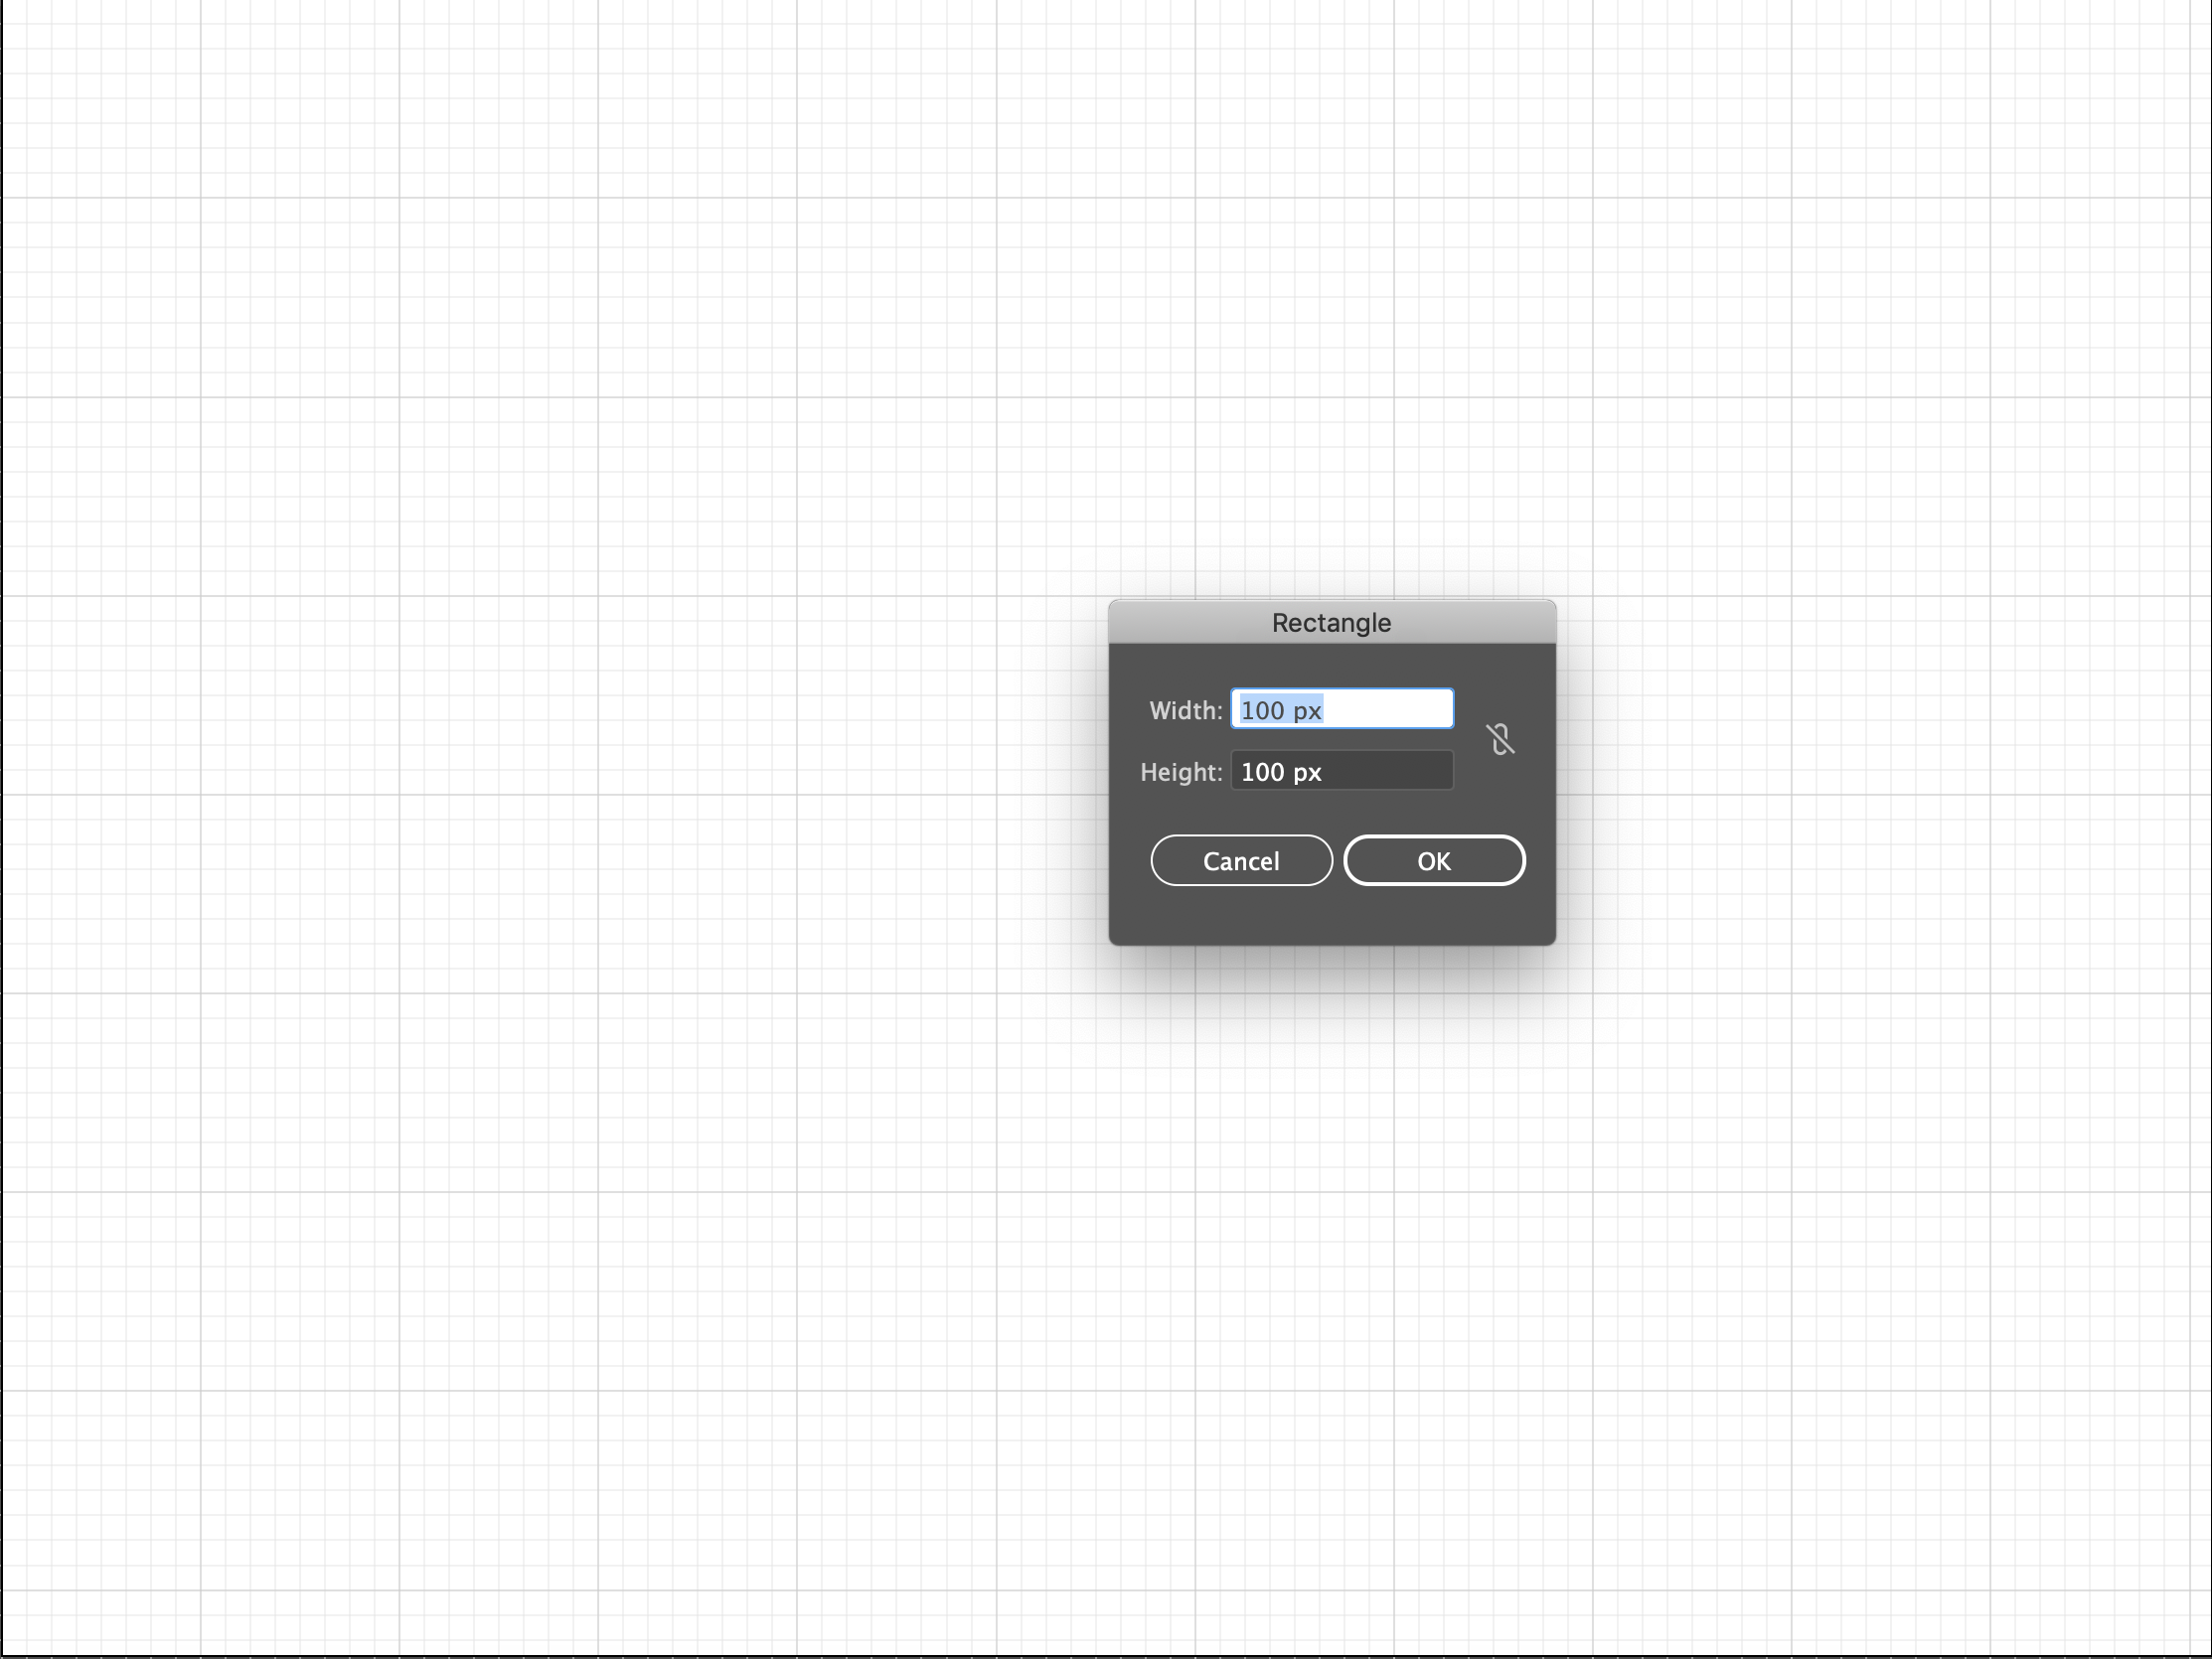
1.4 Split the Square into Grid using Path
Object -> Path-> Split into Grid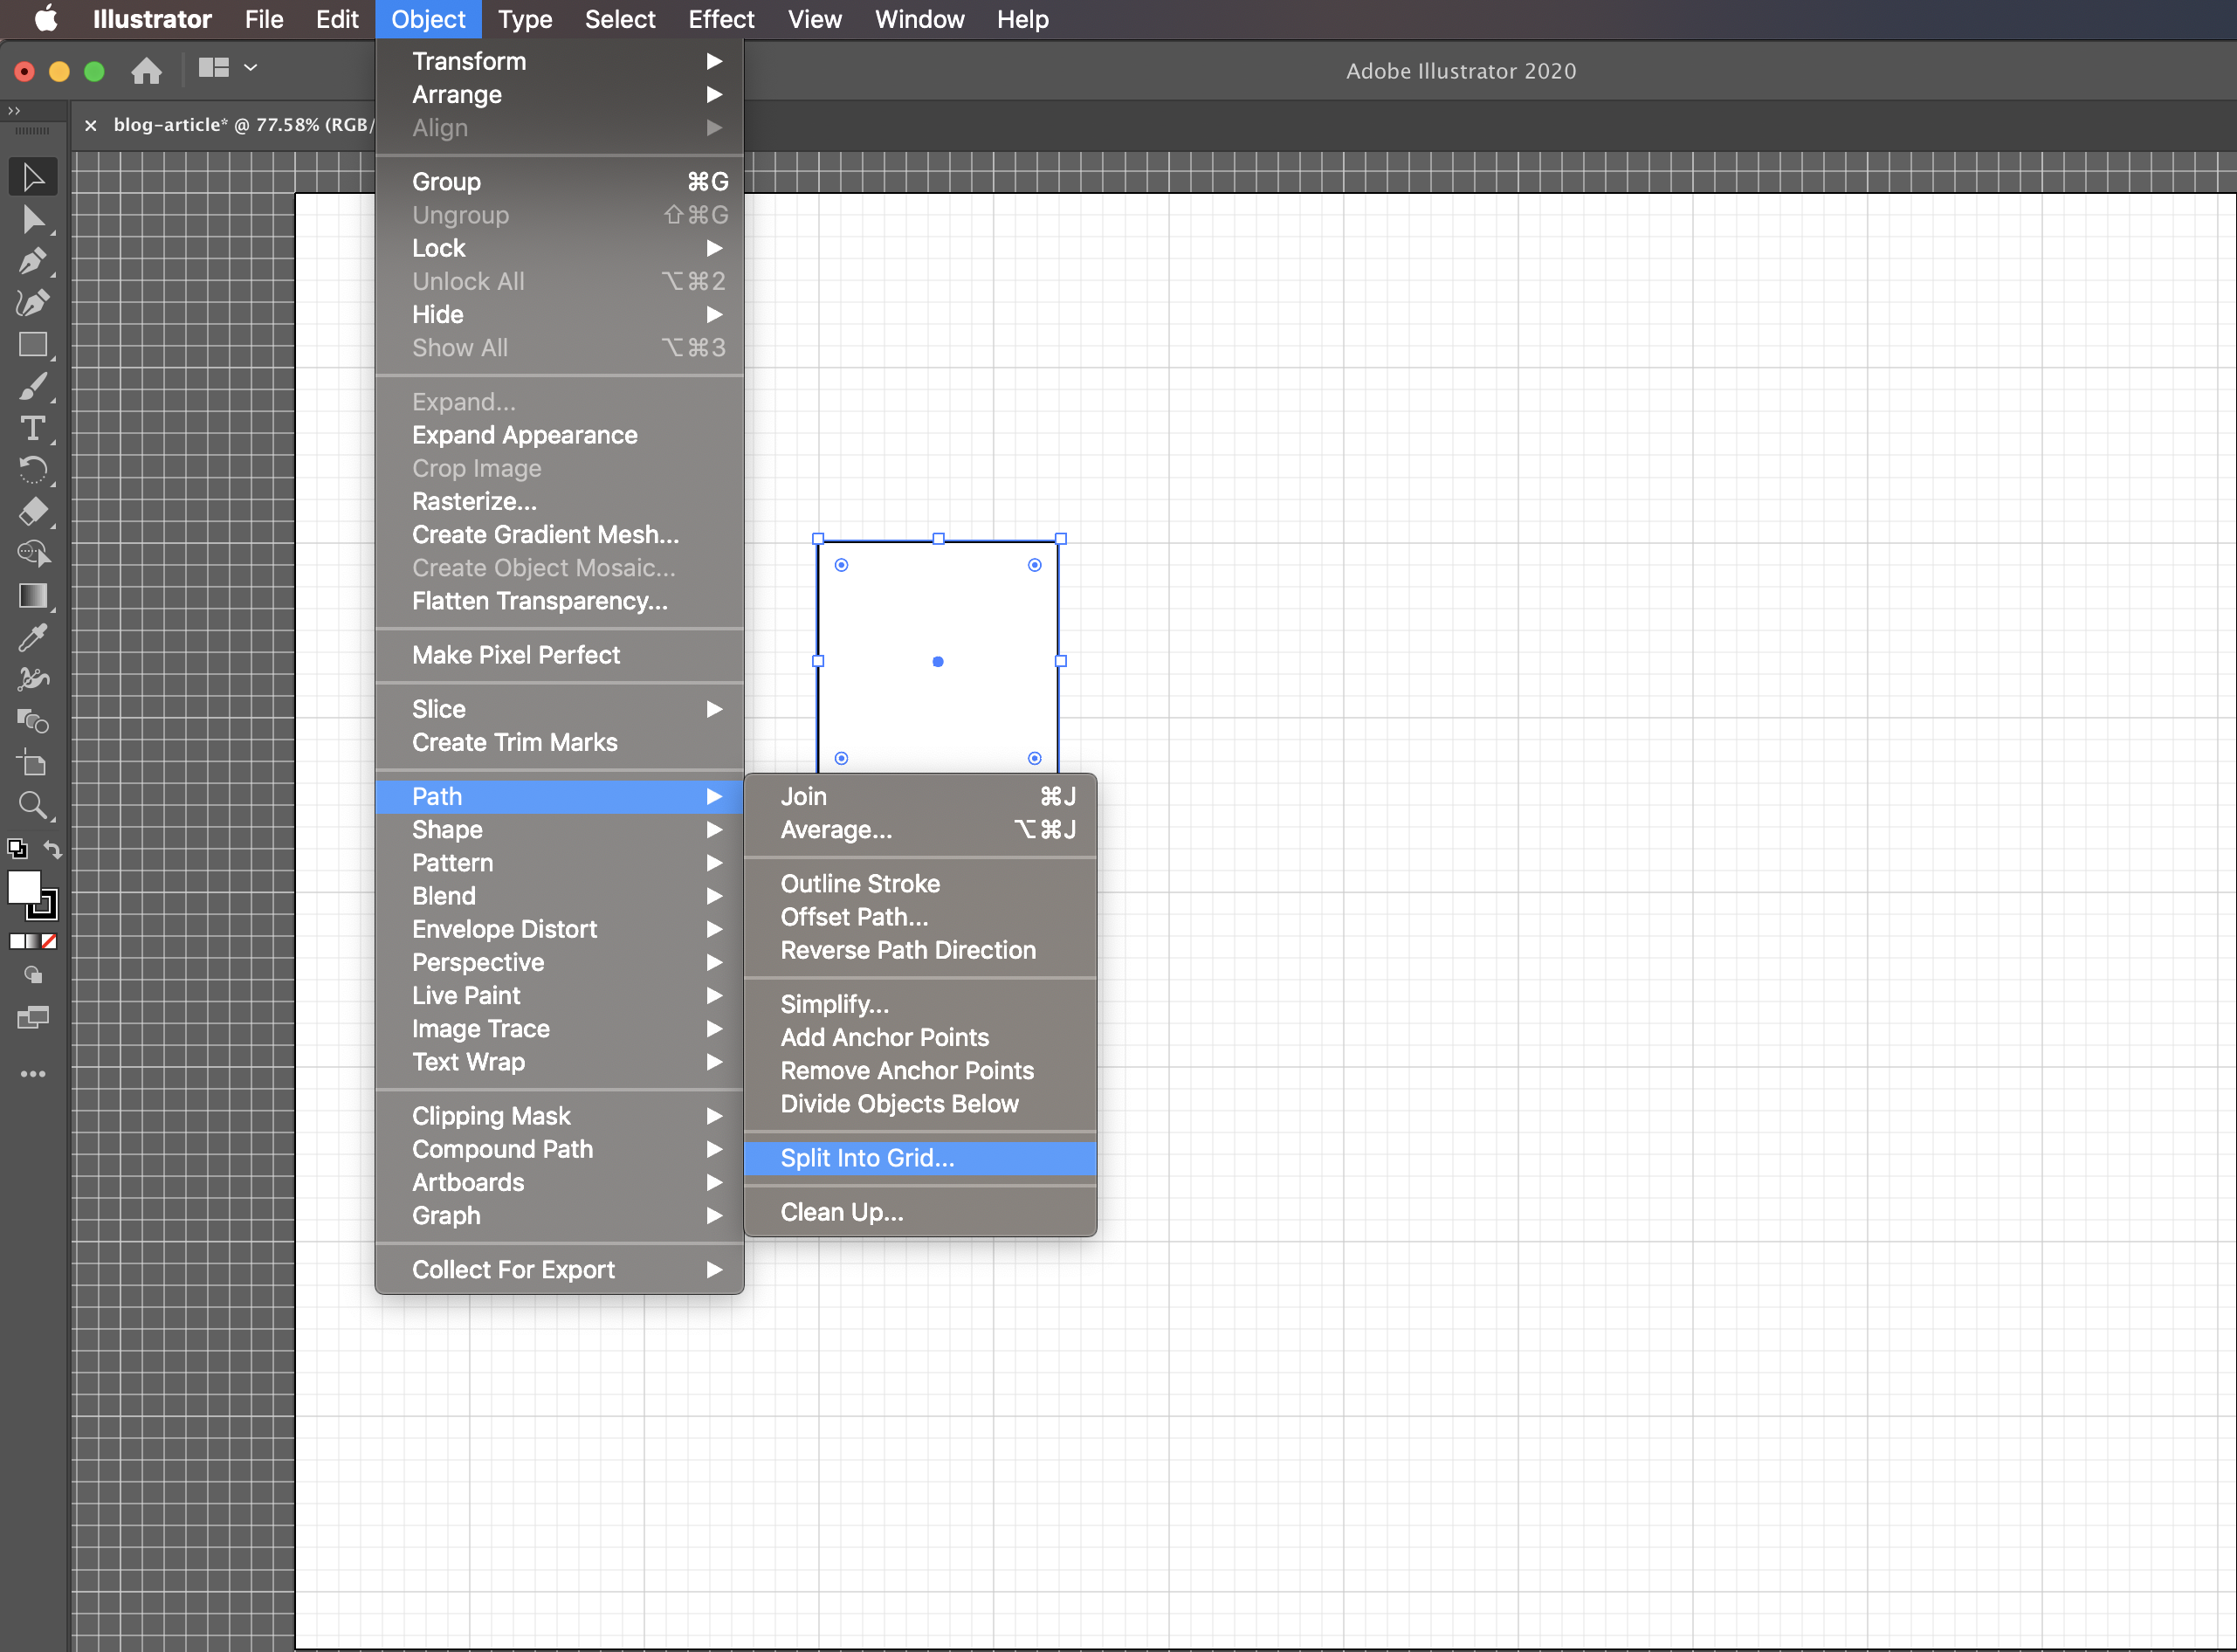
Enter number of rows and columns to split the grid.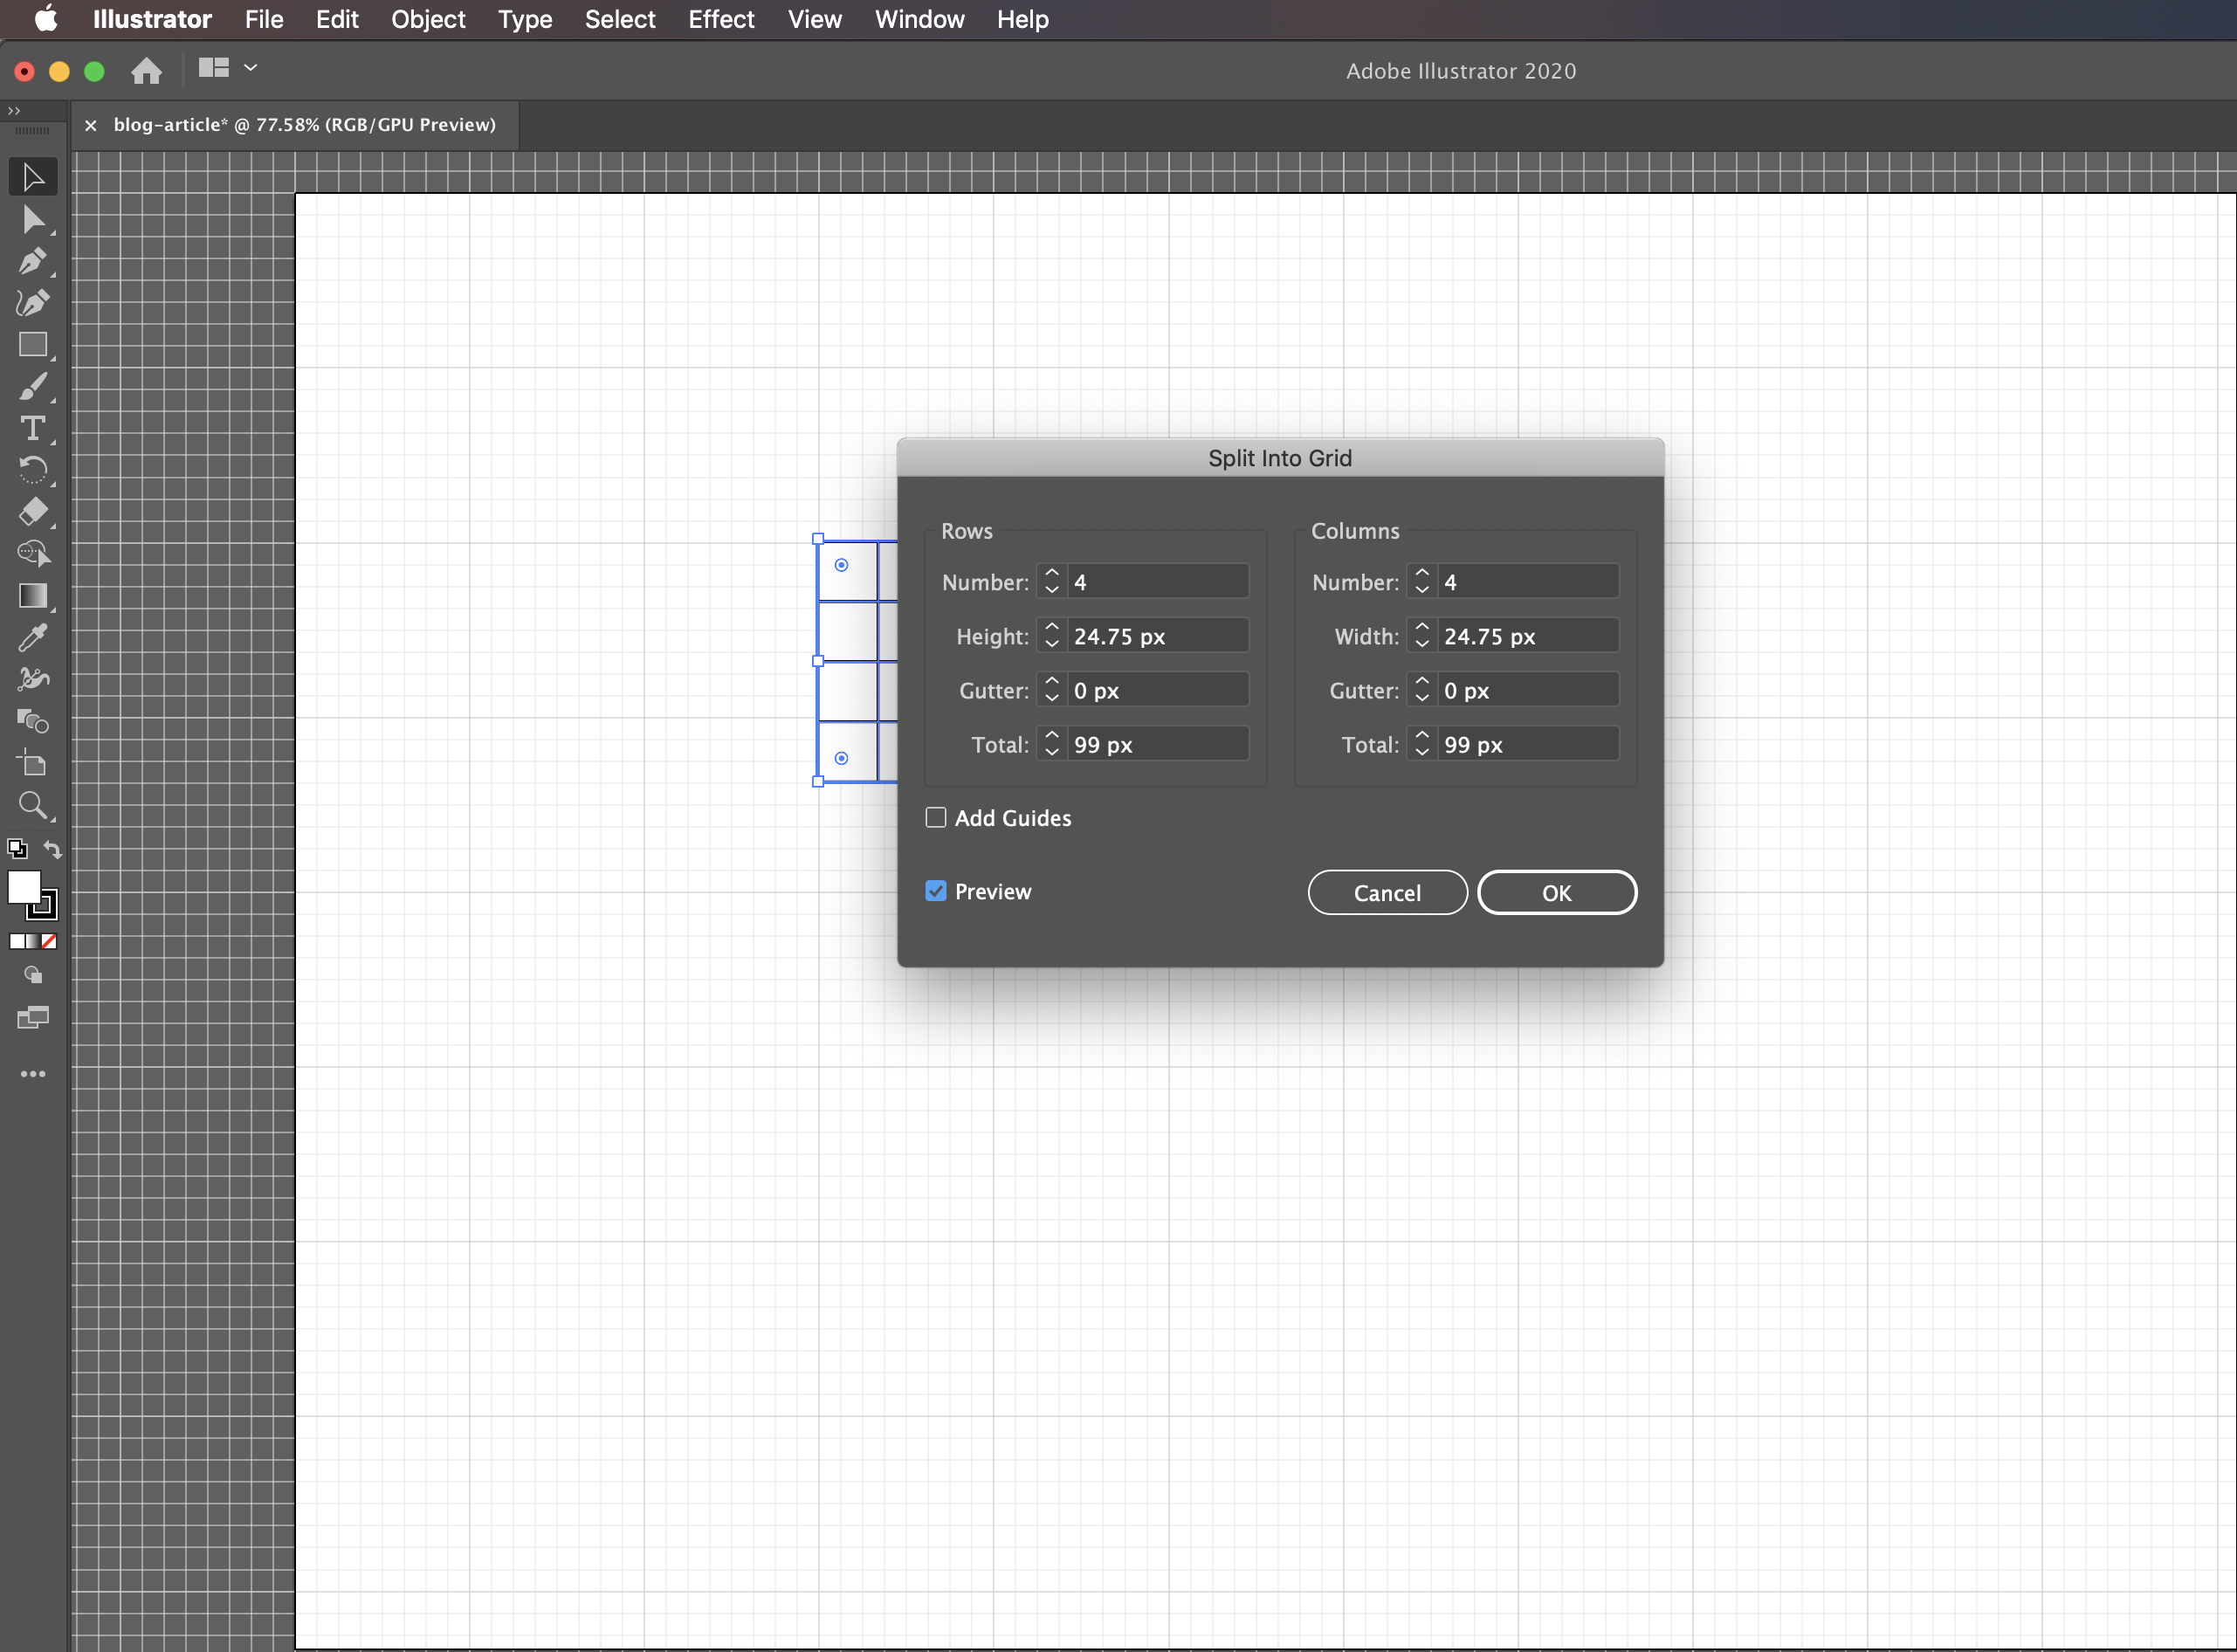
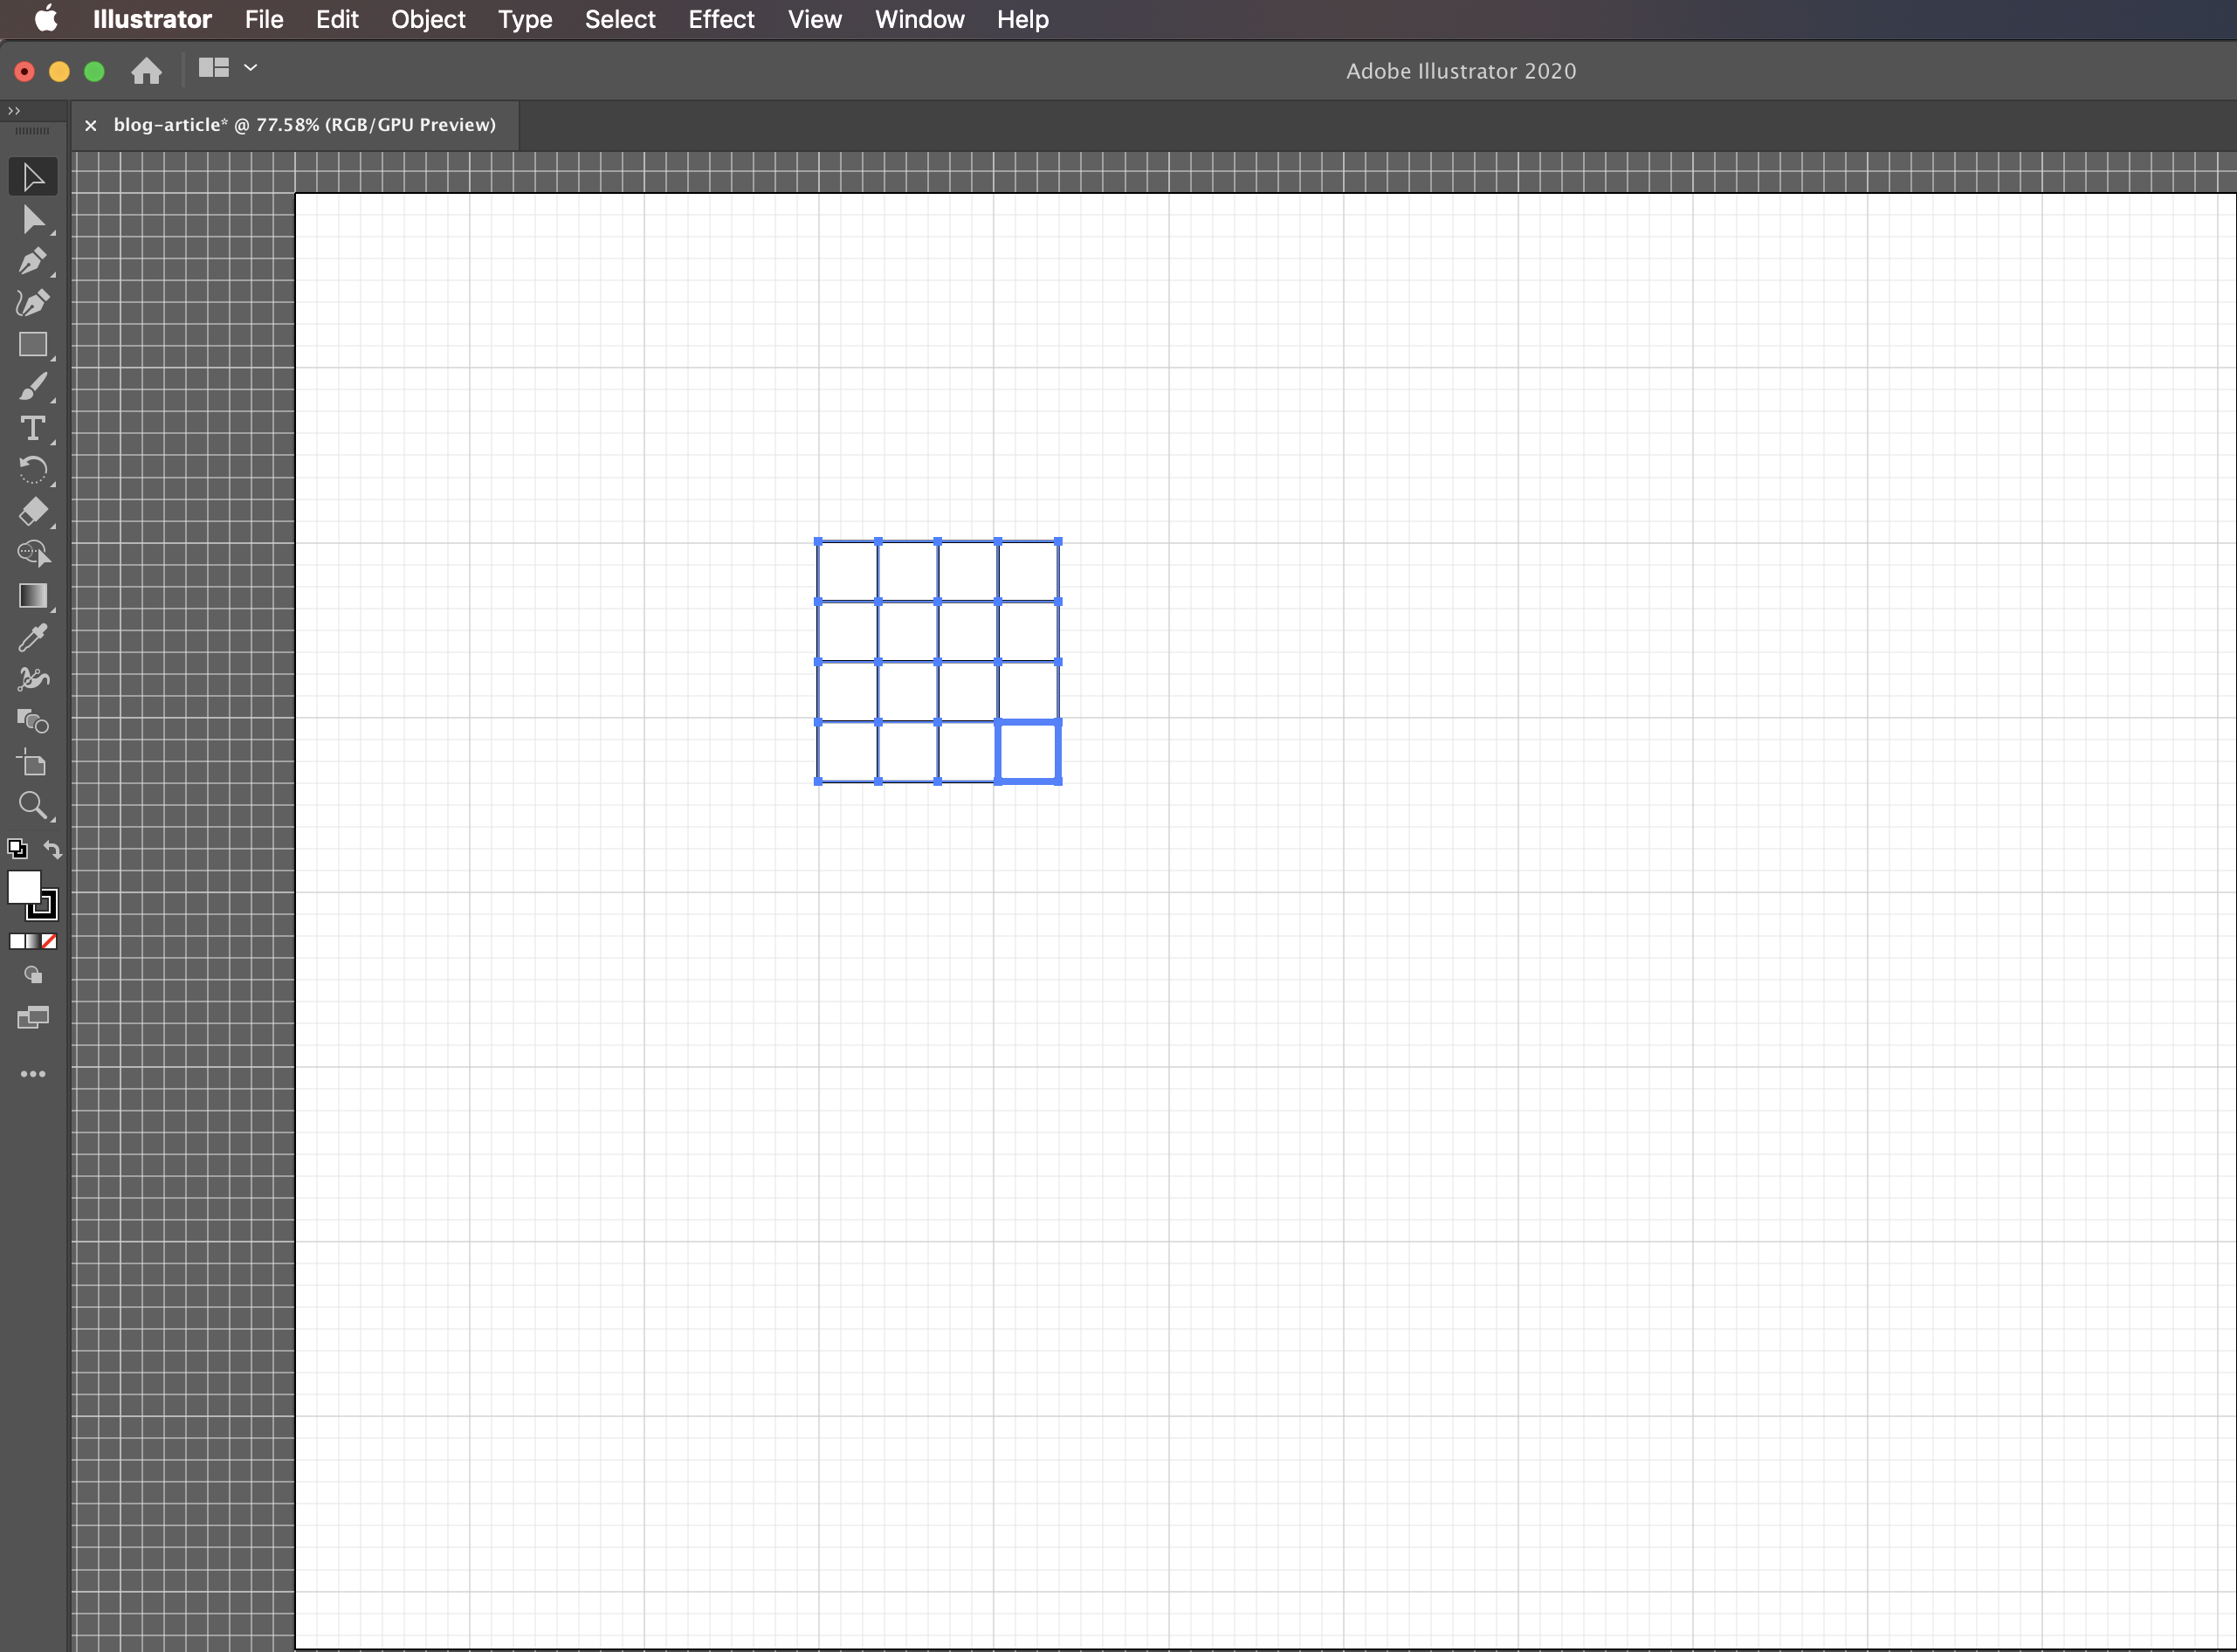
1.5 Final Grid
Now you have the final grid. Here are some examples where a grid can be used.
- Blog: https://malithjayaweera.com/2020/07/blocked-matrix-multiplication/
Diagram: https://malithjayaweera.com/wp-content/uploads/2020/07/matrix-storage.jpg
2. Arrow Notations
Adobe Illustrator provides beautiful arrow styles.
Navigate to
Arrows -> Pattern Arrows -> Select the Pattern Arrow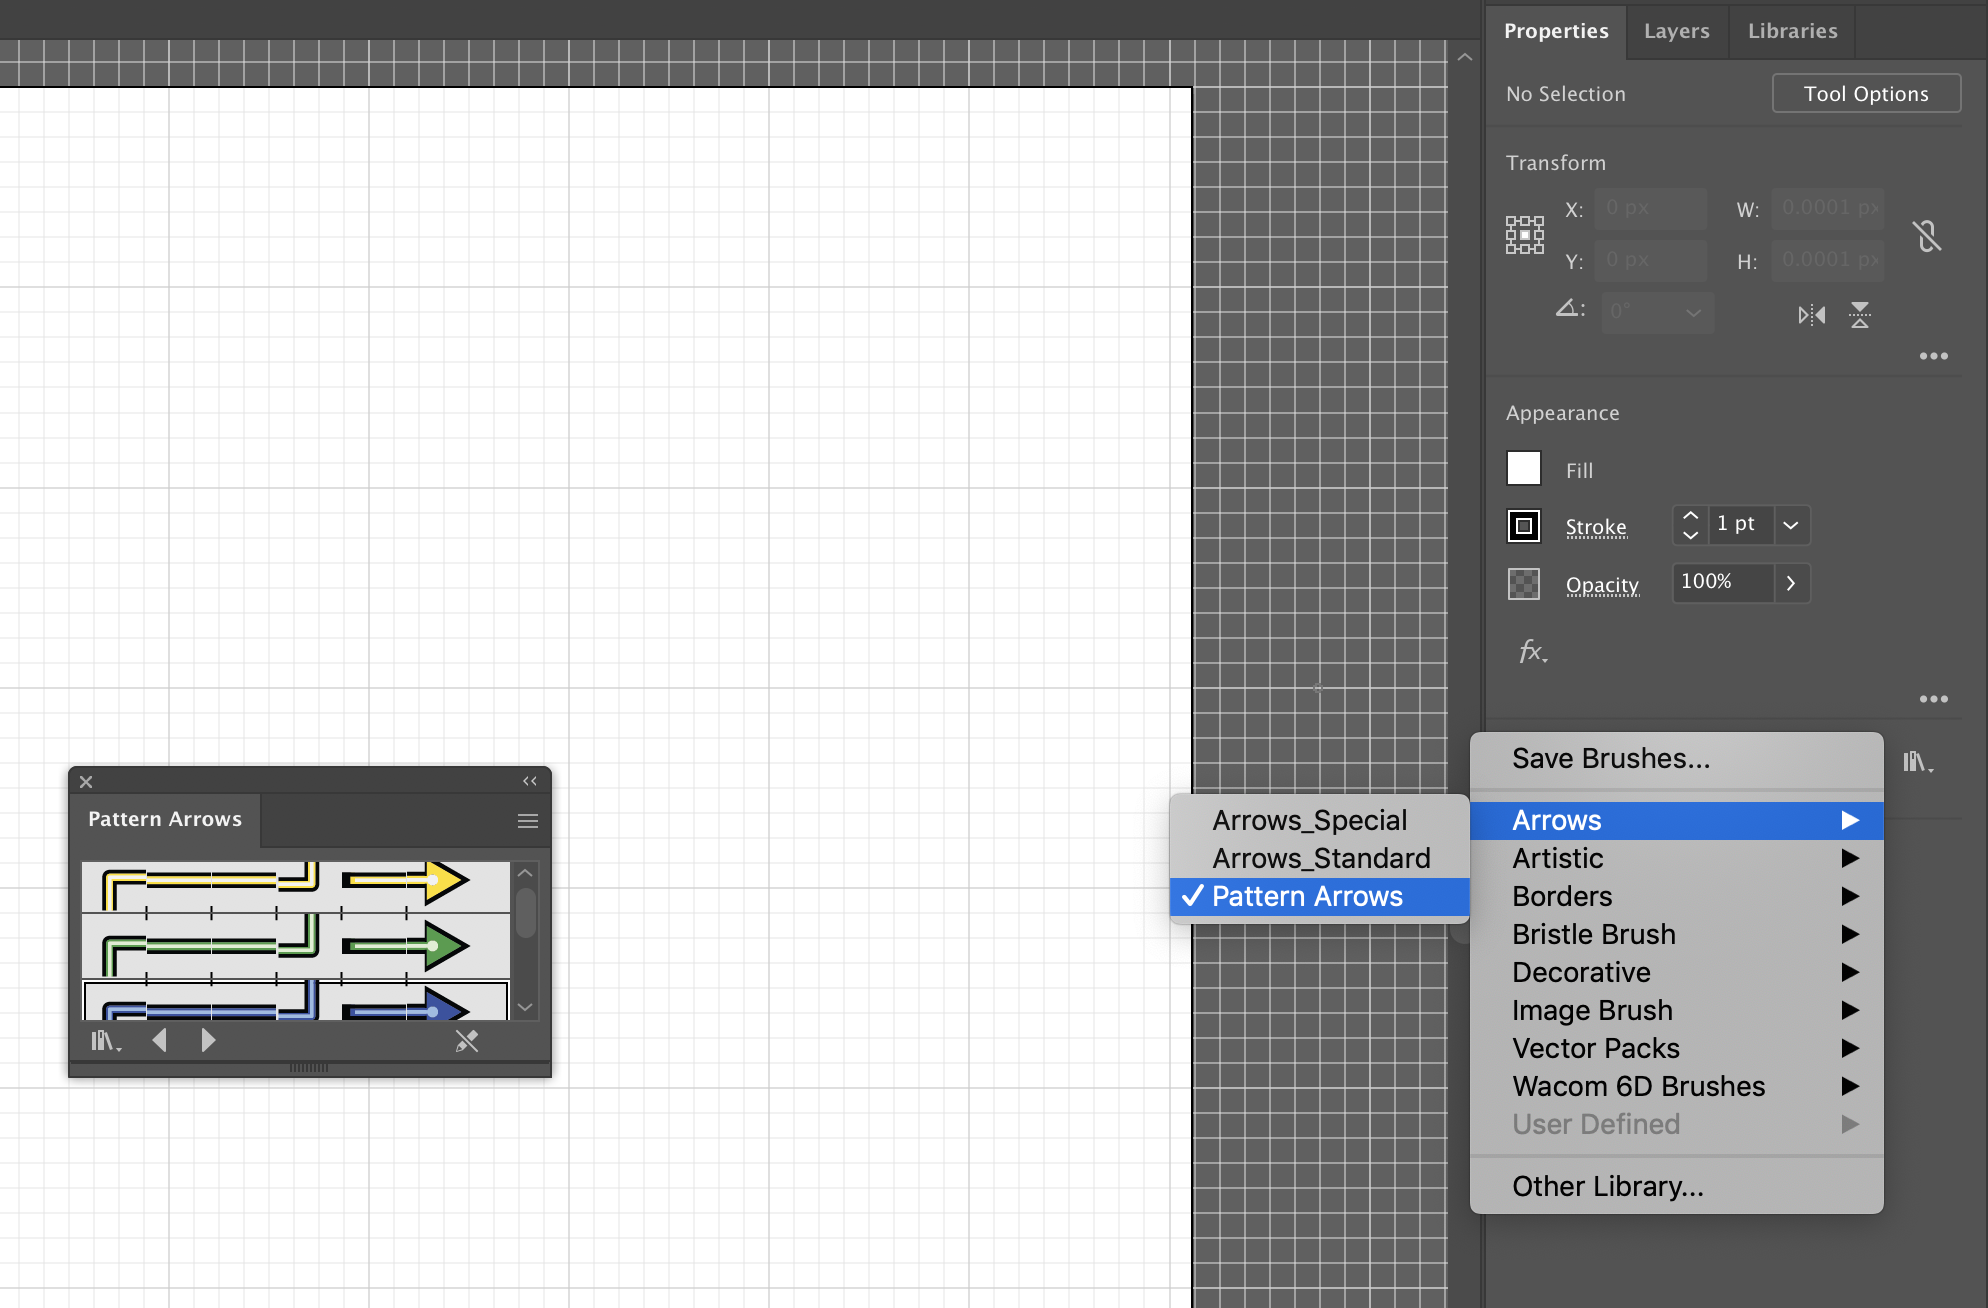
Here are some examples where I used the arrow style.
- Blog: This article
https://malithjayaweera.com/wp-content/uploads/2020/07/rectange-tool.png - Blog: https://malithjayaweera.com/2020/05/create-makefile/
https://malithjayaweera.com/wp-content/uploads/2020/05/makefile_tutorial_1.jpg
3. Typography
Sometimes you need monospaced typography to give the feeling of code. The typography of Adobe Illustrator “Code Save Regular” is a life saver.
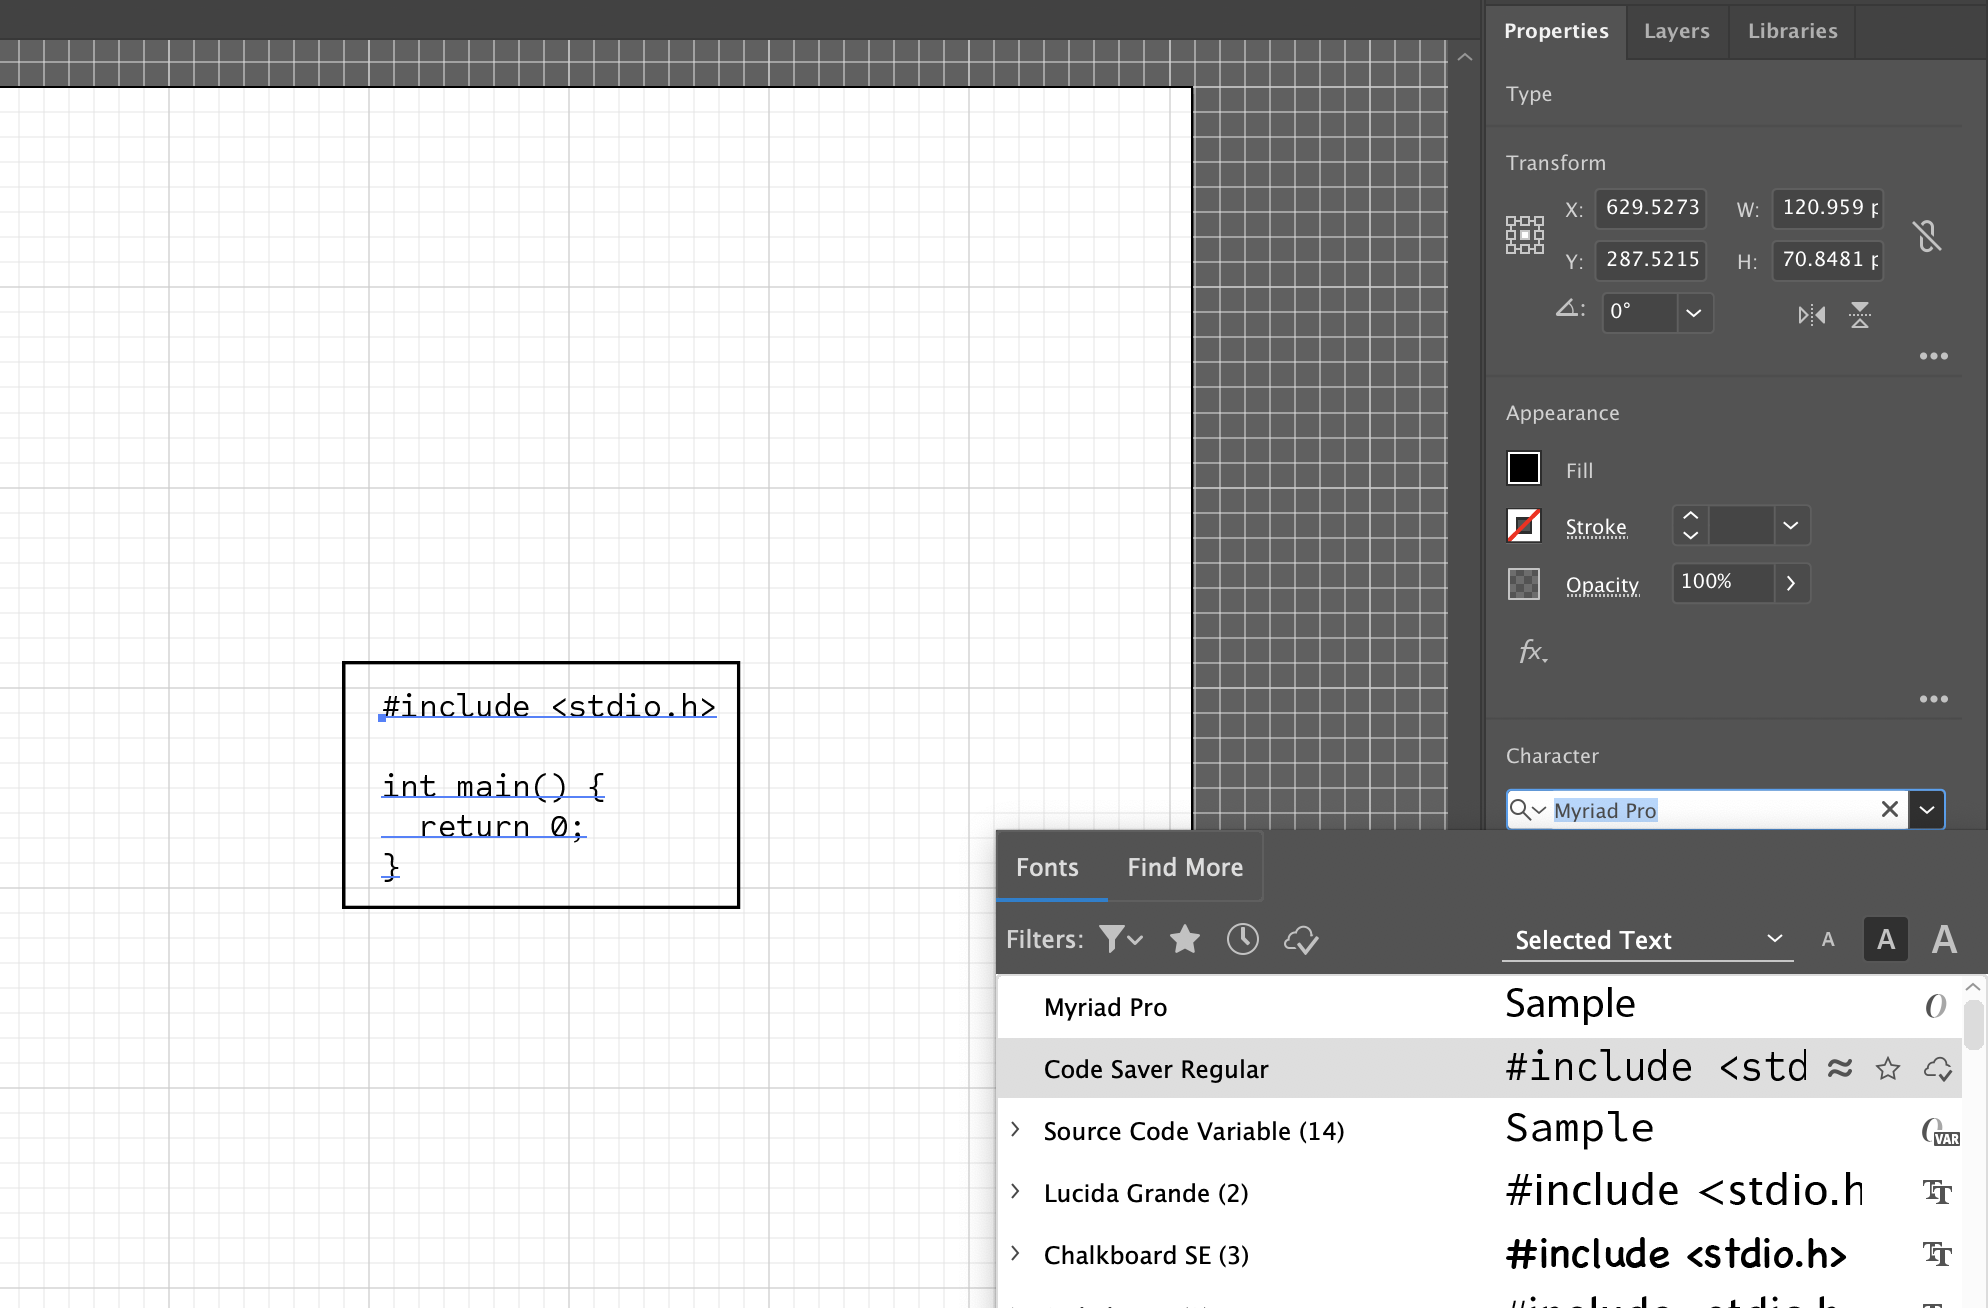
Here are some examples where I used the Code Save Regular typography.
- Blog: https://malithjayaweera.com/2020/05/create-makefile/
- Blog: https://malithjayaweera.com/2020/07/blocked-matrix-multiplication/
4. Shaded Colors (Gradient)
AI provides a rich set of gradient colors and it’s easier than it looks.
start with a square from step 1)select fill color (the color which the object is filled with)
and the stroke color (the color which the object border is
colored with).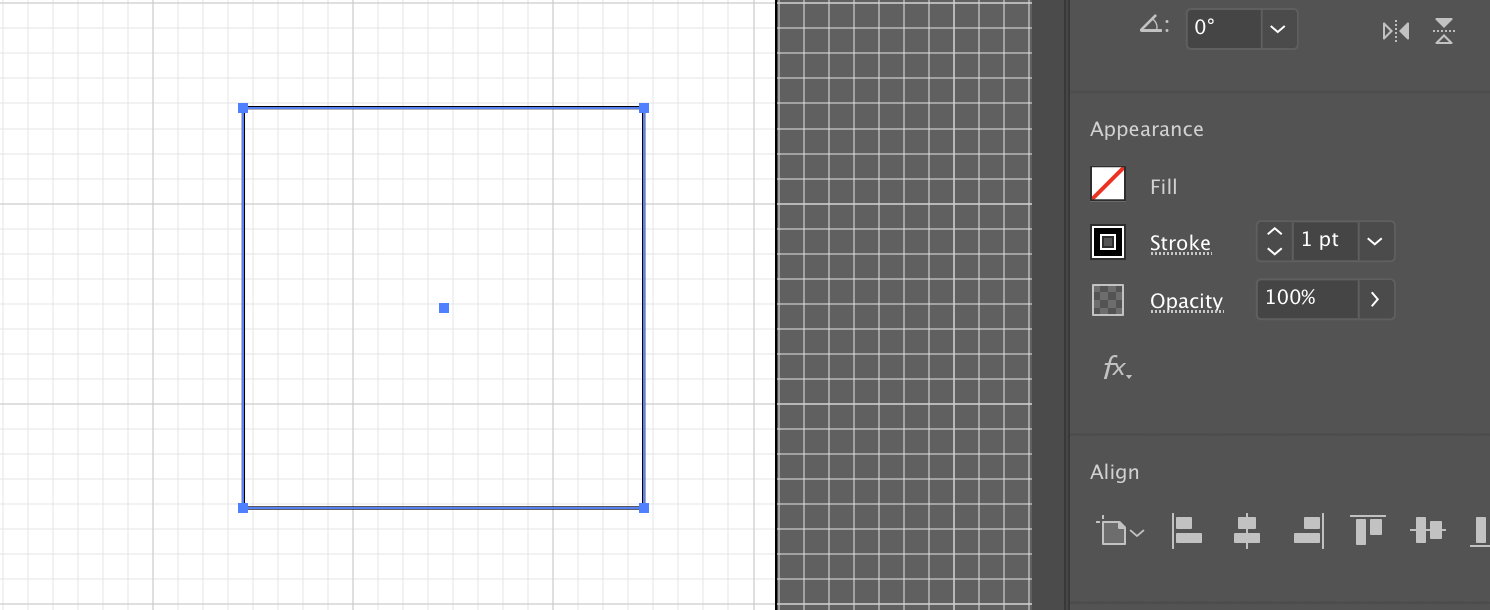
If you double click the color option on the left tools pane, you will
also get access to an advanced color palette. The fill color is
the full box and stroke color is the outlined box just below
it.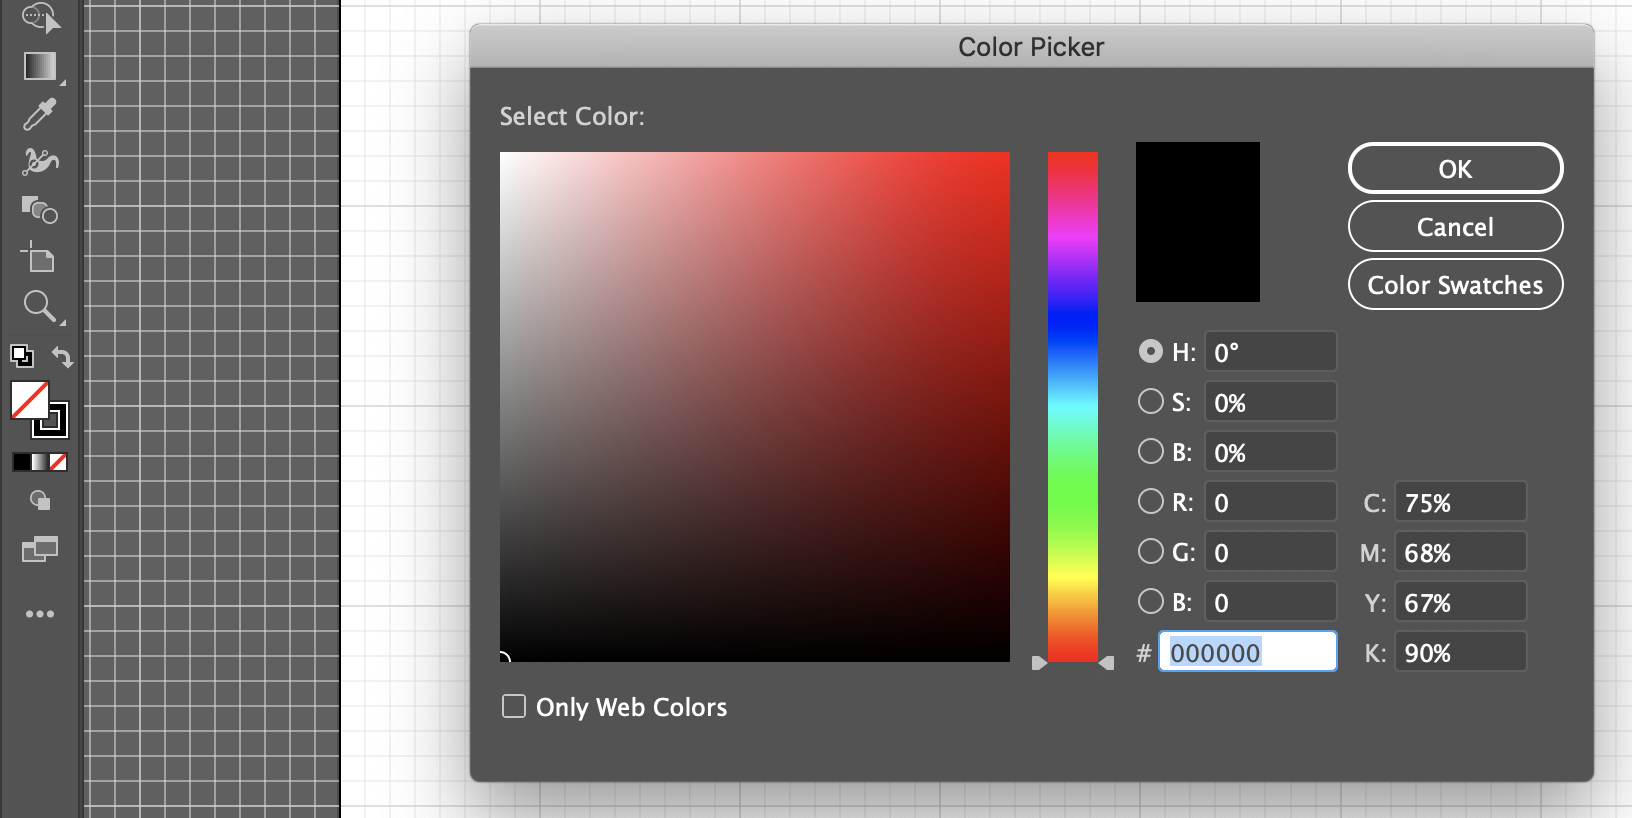
Click on gradient option in the tools pane.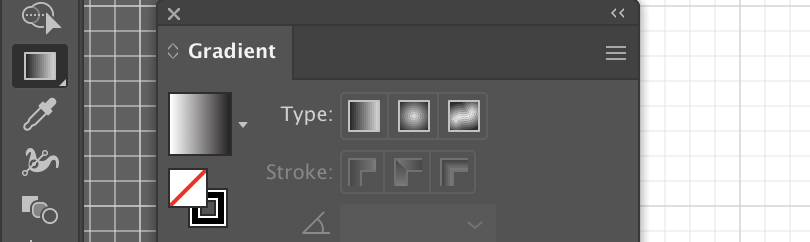
Double click the color box in the gradient tool box.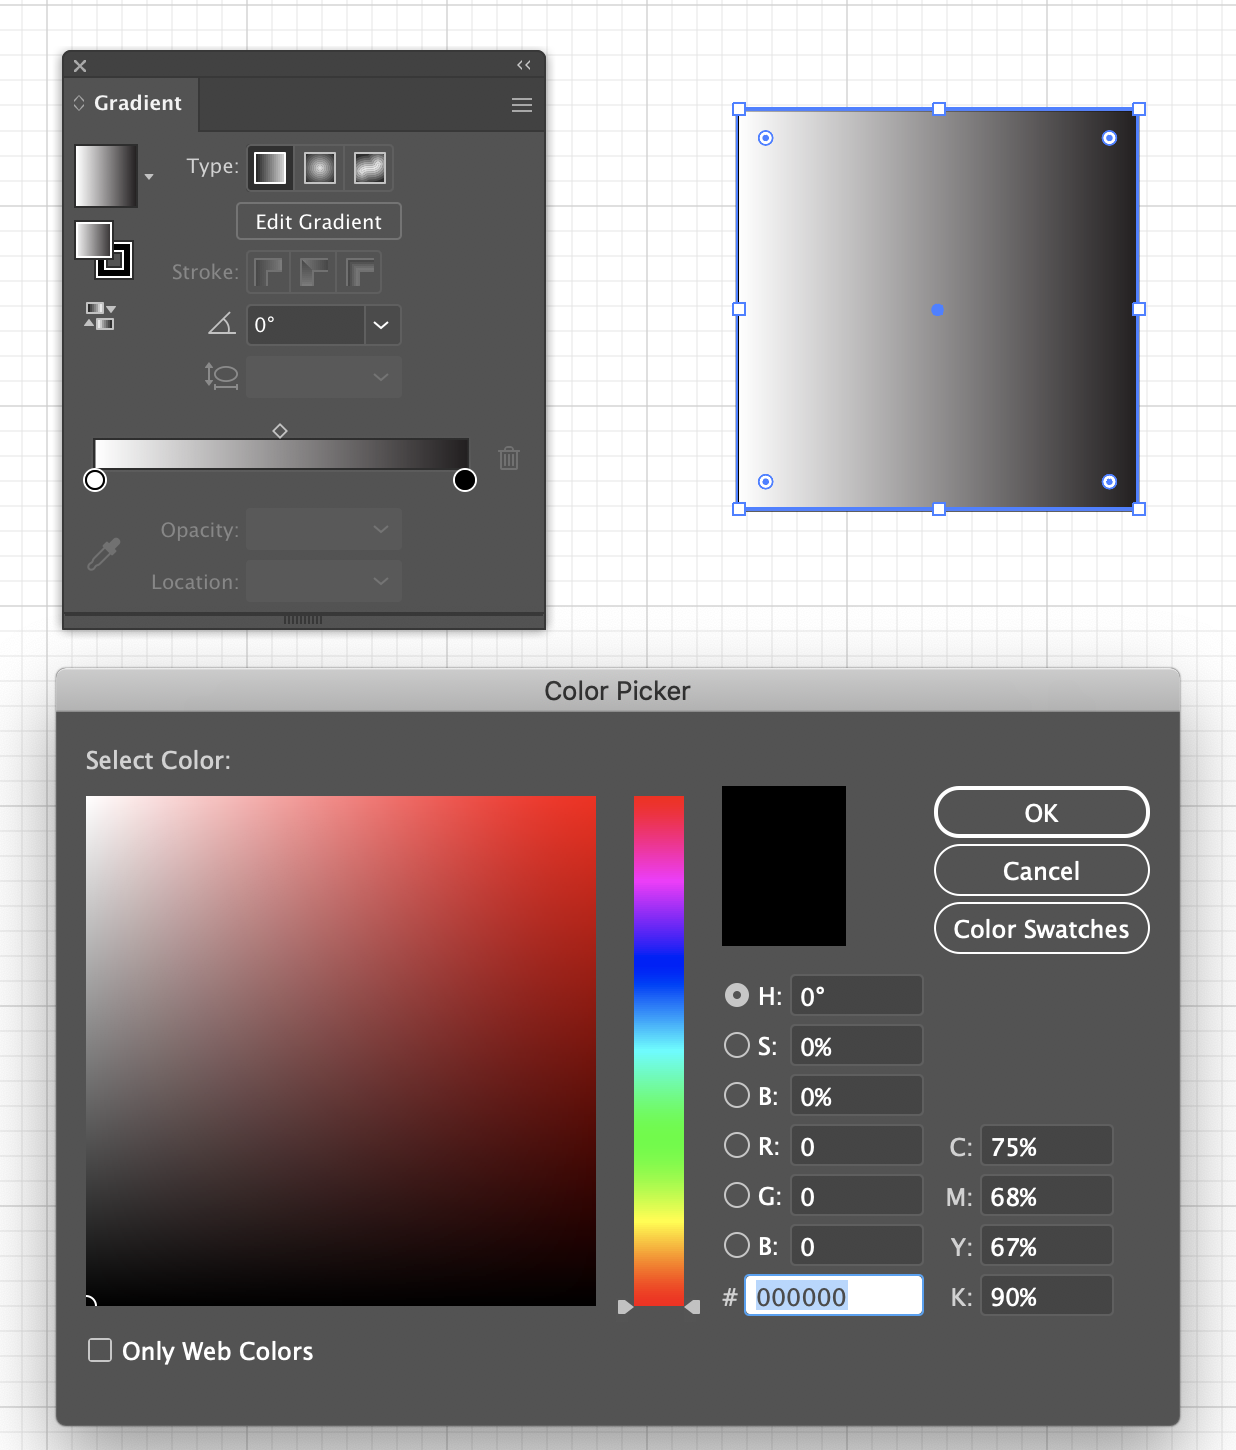
Now click on the opposite sides of the color slide bar in the
gradient tool to choose two colors.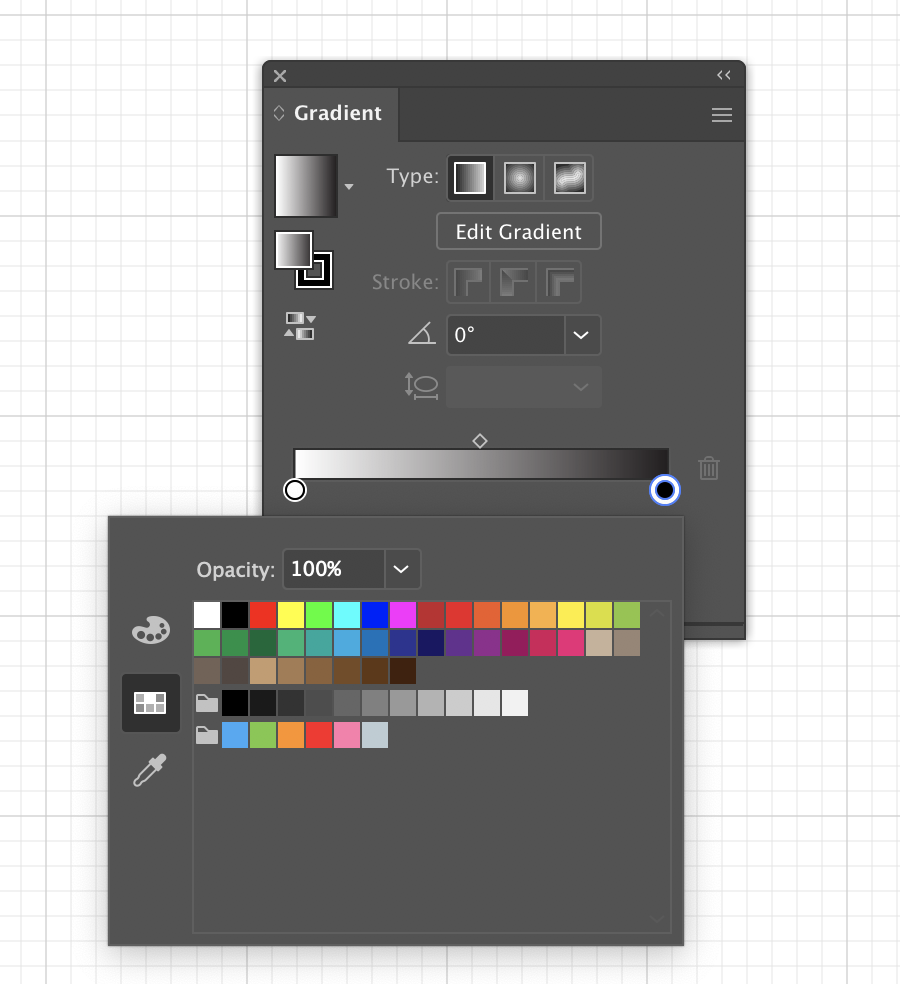
Here's an example of two colors that I chose.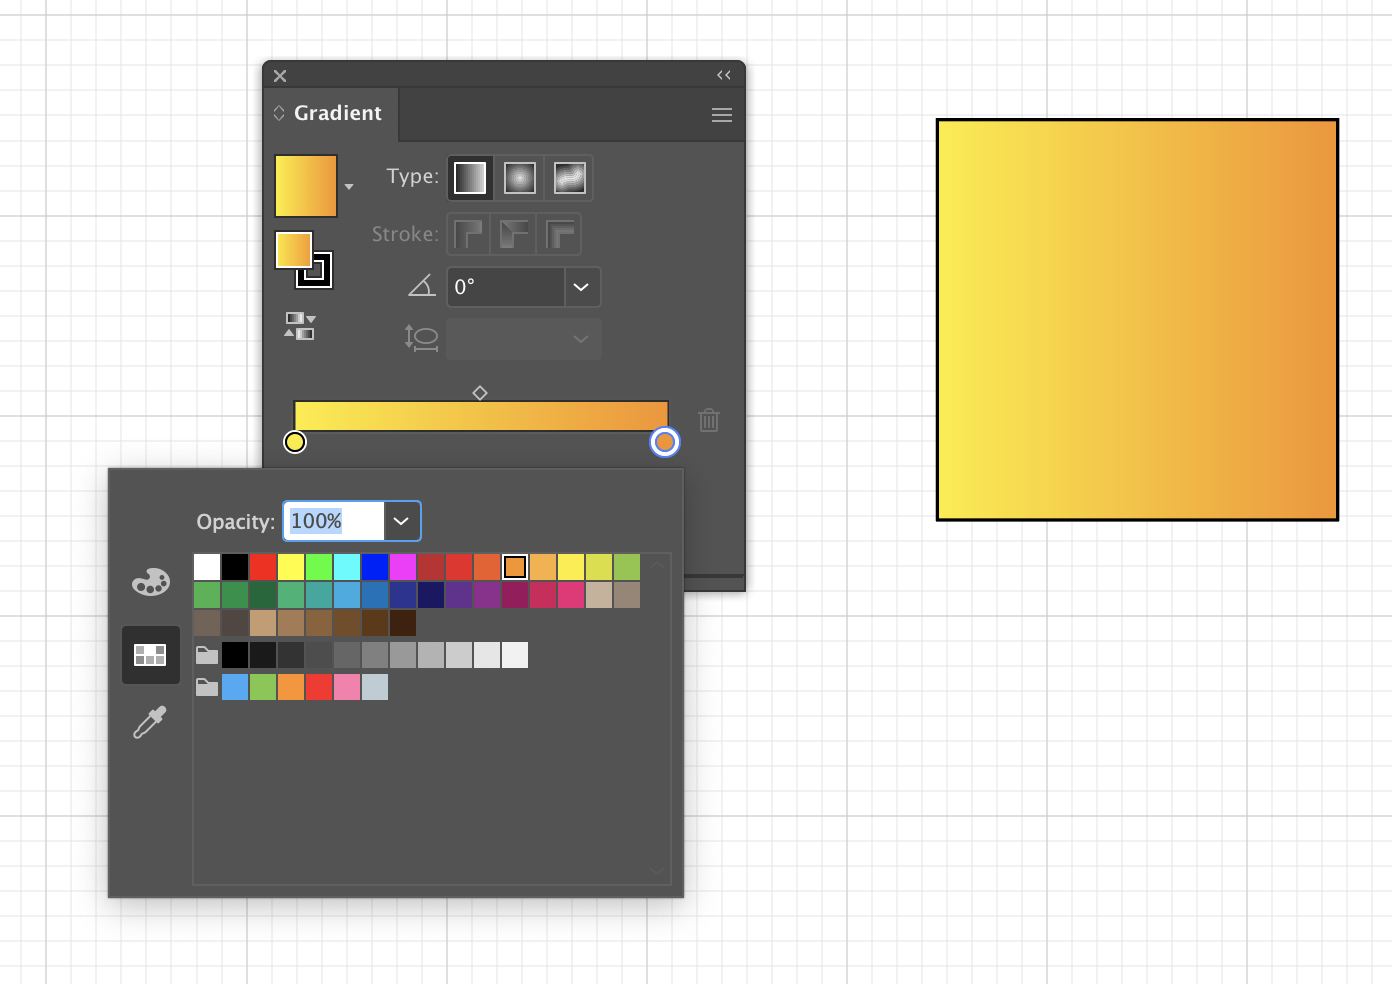
Use the gradient slider to fine tune the mixture of colors.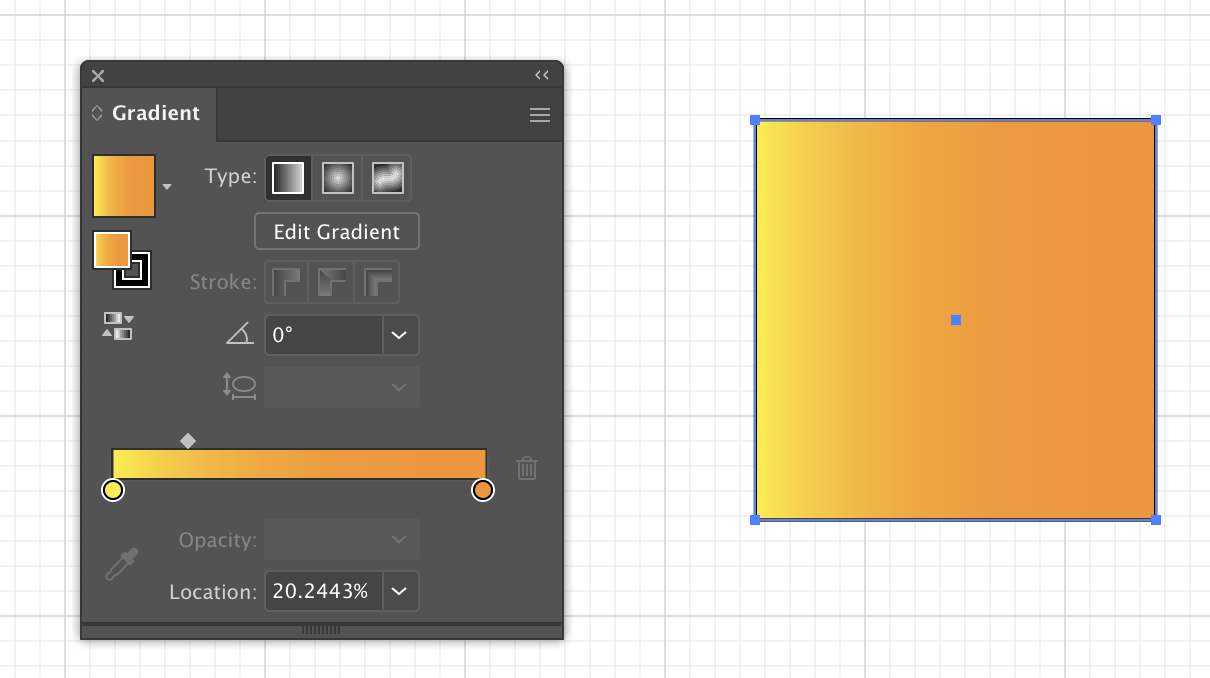
Here are some examples where I used the Code Save Regular typography.
- Blog: https://malithjayaweera.com/2020/07/blocked-matrix-multiplication/
Matrices: https://malithjayaweera.com/wp-content/uploads/2020/07/matrix-storage.jpg
5. Type on a Path
To explain the connections in your diagrams, text on paths are extremely useful.
Click on the type on the path tool by right clicking on text
button in left selection pane. 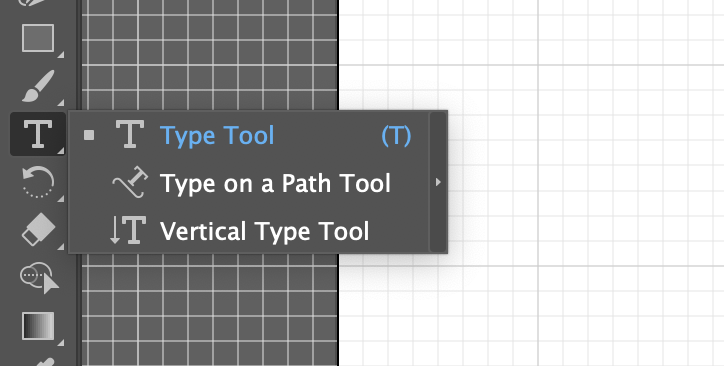
But first we need to create an offset around our square object.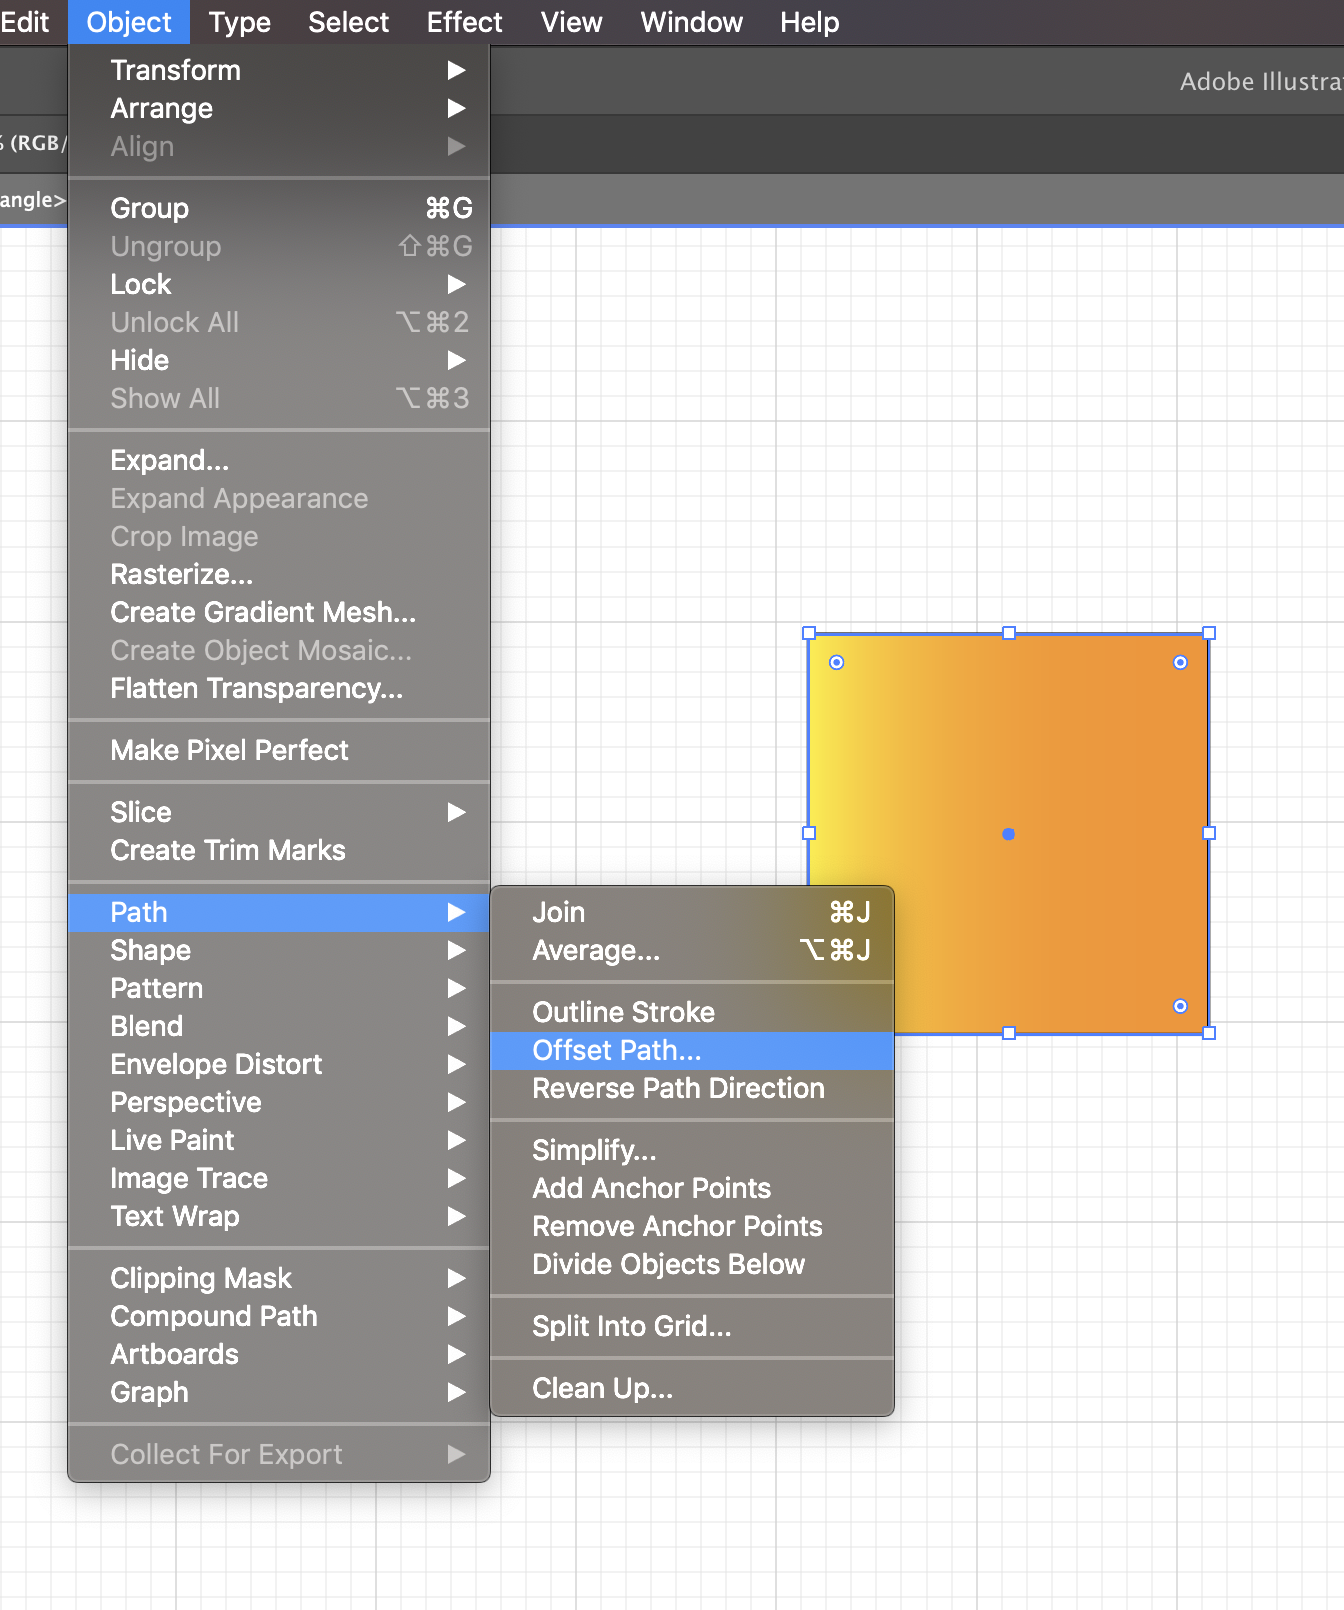
Set the offset to be 10px using the dialog box.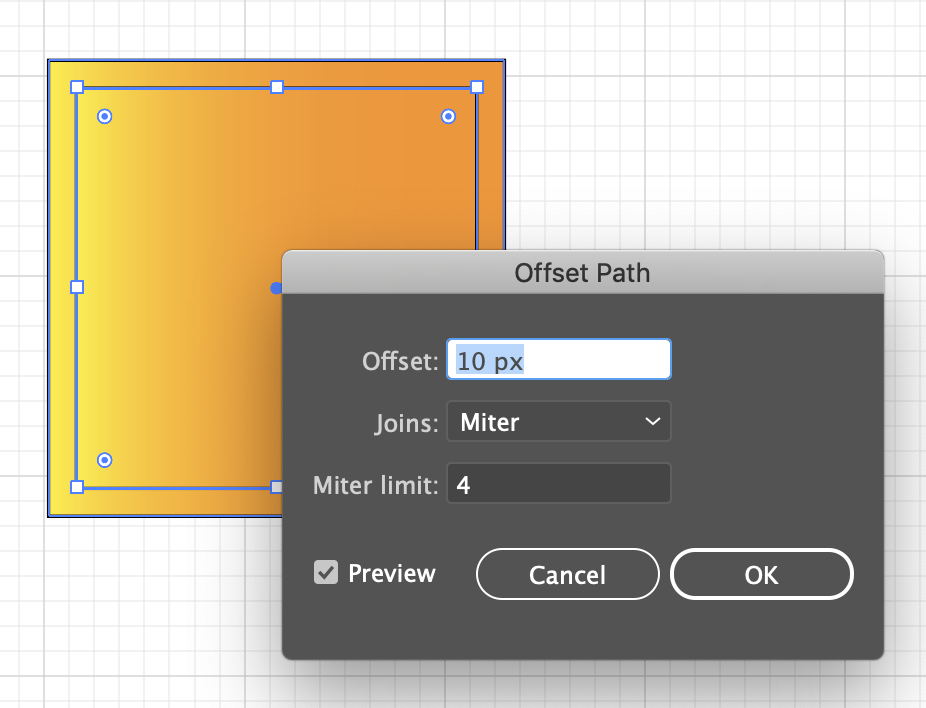
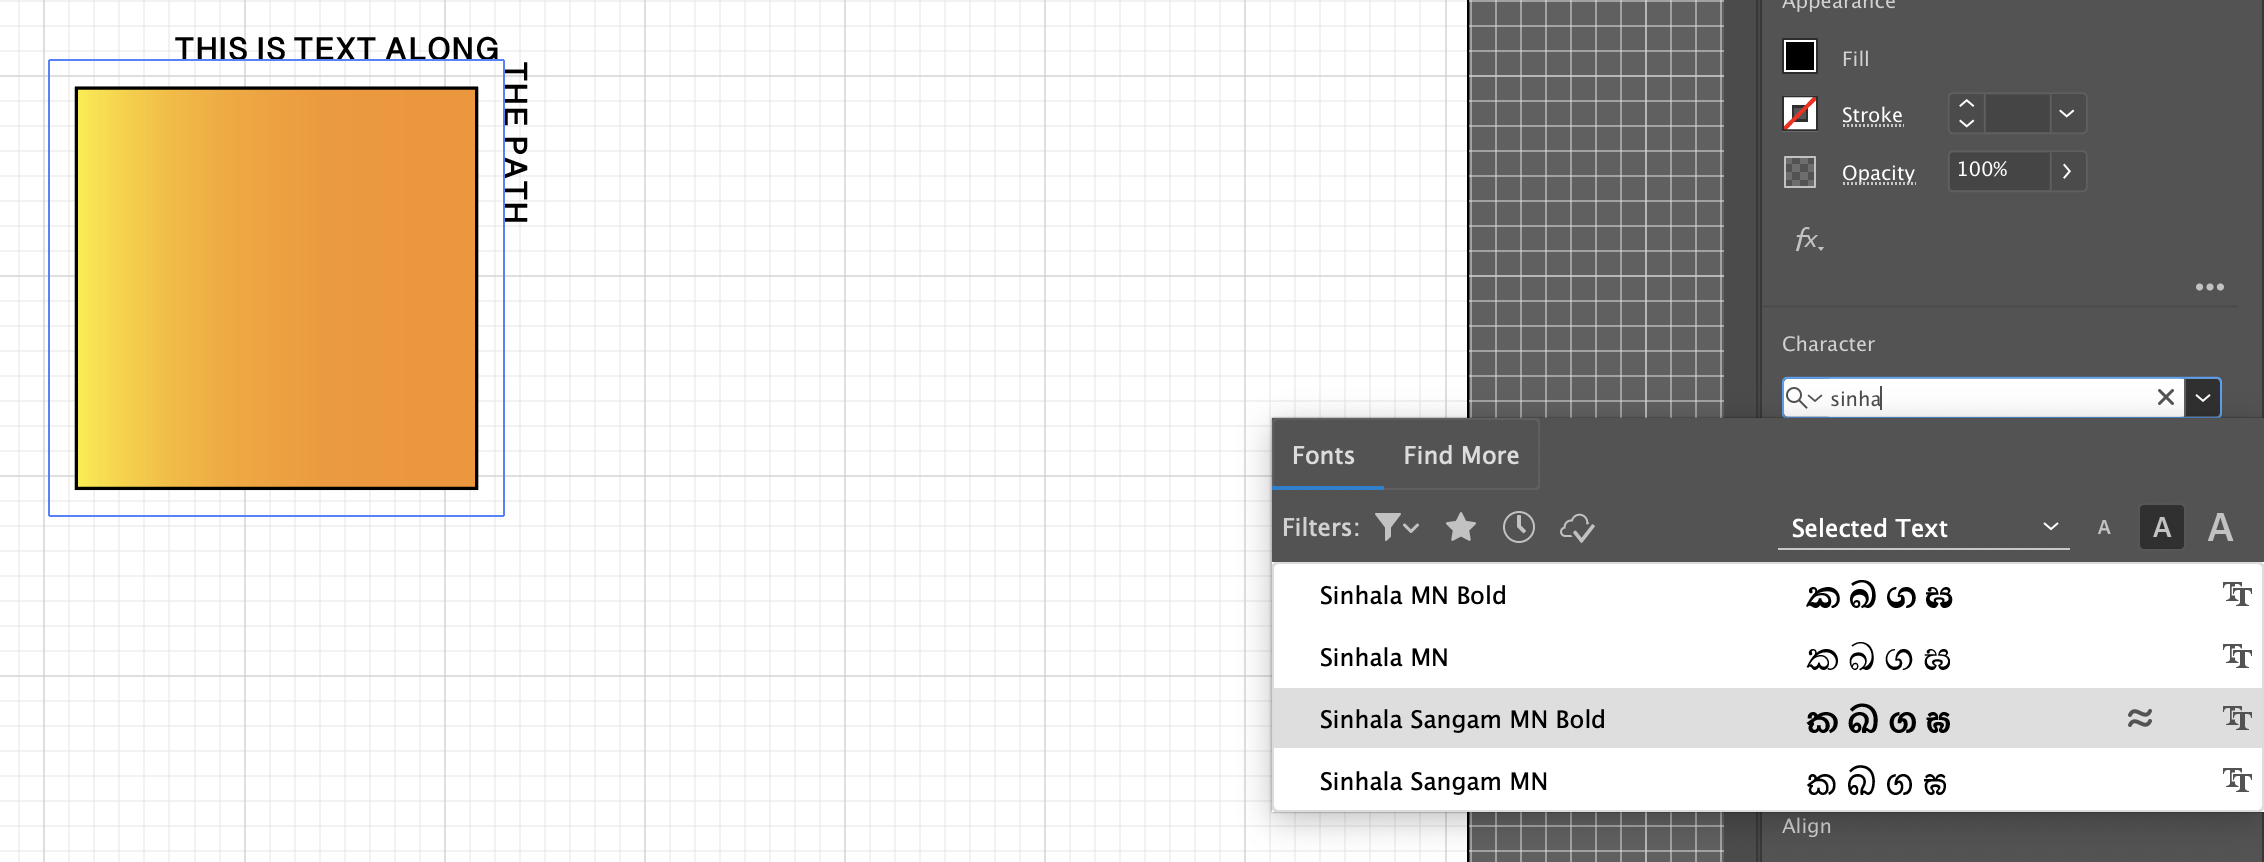
Now click on "type on path tool" and select the outer border of
the square object. You will see the text appear as follows.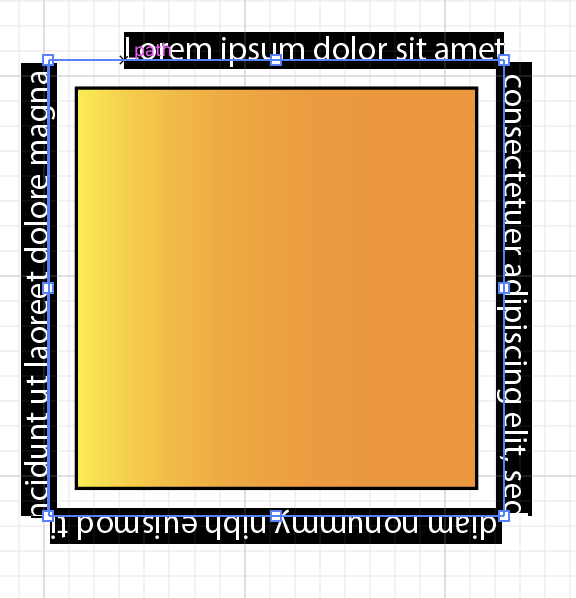
Here’s the final result.
and that’s it. Let me know in the comments section if these tips were helpful to get a quick start with Adobe Illustrator to create beautiful Computer Science diagrams / illustrations.